Download
1 / 84
840 likes | 1.03k Views
Enrollment management division fall 2009 Kick-off : “Continuing Success by Doing the Basics BETTER”. August 11, 2009 . Founded 1870 | Rolla, Missouri, USA. Kick-Off Agenda. Let’s use today for some serious discussion, planning and a good time with colleagues!. Welcome & Thanks

E N D
Enrollment managementdivision fall 2009Kick-off:“Continuing Success by Doing the Basics BETTER” August 11, 2009 Founded 1870 | Rolla, Missouri, USA
Kick-Off Agenda Let’s use today for some serious discussion, planning and a good time with colleagues! • Welcome & Thanks • 2008-09 Accomplishments • 2009-10 Goals & Initiatives • Strategic Planning for Our Future • Opening Week Overview
enrollment.mst.edu 2009 New Student Profile Founded 1870 | Rolla, Missouri
Freshmen ClassOpening Week Profile - Fall 2009 • Insert Freshmen 2009 Picture at the Puck Here
1,121 Freshmen Enrolled or Deposited for Opening Week 296 New Transfer Students scheduled to Enroll*One of the 3 largest and most talented new student classes in Missouri S&T history. 29 states represented (Massachusetts to California) +10 foreign countries represented Ave. ACT: 27.7 (upper 8% in nation, four perfect ACT & one SAT scores) Ave. HS GPA: 3.78 71% have a 3.5 GPA or higher 45% from upper 10% of high school class 80% from upper 30% of high school class 95 Valedictorians and Salutatorians 14% from non-ranking schools Freshmen ClassOpening Week Profile - Fall 2009 NOTE: Opening Week data are UNOFFICIAL MISSOURI S&T enrollment figures and are intended for internal campus planning purposes. Official enrollment counts will be available after the fourth week of classes each semester.
New Undergraduate Classes60% Growth Since Fall 2000 * Projected headcount for Fall 2009 NOTE: Opening Week data are UNOFFICIAL MISSOURI S&T enrollment figures and are intended for internal campus planning purposes. Official enrollment counts will be available after the fourth week of classes each semester.
EM Division Accomplishments 2008-2009 • Met our core mission and goals: Exceeded the new student class targets for quantity, quality, and diversity • GREEN INITIATIVES: Over 14!! • WLI: Achieving 24% goal for freshman class and possibly the all-time total female enrollment record • SFA: Implementation of practices and data coordination produced $150,000 in additional aid, over $328,000 GO offsetting and 100,000 in additional loan funds • PRE COLLEGE: Expanded On and Off Camp offerings: 27 STEM camps for over 1600 1-12 grade students with significant diversity (20% minority and 26% female) • Improvements/enhancements to Joe SS: order and pay for official transcripts, contact data collection system for emergency contacts and e-loading freshmen math placement scores • SDP: Implemented three new retention programs • ADMISSIONS: Implemented new program and staff assessments resulting in a number of improvement plans • REPORTING and E-COMM: Website & graphic identity enhancements
Strategic Enrollment Management (SEM) at Missouri S&T 2001-2009 RECORD GROWTH DECLINING INTEREST “Succeeding while Swimming Against the Tide”
46% “Economy has Changed Which College Students will Attend” SOURCE: Longmire & Company, Inc. 2009 “Study of the Impact of the Economy on Enrollment”
76% indicated they would be “somewhat” or “very likely” to consider the more expensive institution if it could deliver greater value SOURCE: Longmire & Company, Inc. 2009 “Study of the Impact of the Economy on Enrollment”
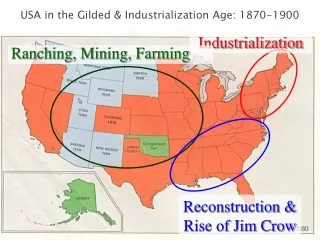
Challenge: changes in the college-bound student markets • The Midwest and Northeast will experience a 4% to 10% decline in high school graduates between 2009 – 2014 (WICHE) • The profile of college-bound students is rapidly becoming more ethnically diverse and female dominant (NCES, WICHE, ACT, College Board) • The number of students interested in engineering, computer science, and natural science degrees has declined to record lows (ACT, CIRP) • More full-time college freshmen are choosing to start at two-year colleges (IPED, MODHE) • More students are enrolling in more than one college at a time (National Student Clearinghouse) • Future student market growth will include more students requiring financial aid and loans to complete a degree (WICHE)
Enrollment Management Missionapproved: June 2001 The Division of Enrollment Management coordinates student enrollment services for the University, working collaboratively with the academic units, student affairs and administrative units to identify and implement processes to meet, and strive to exceed student/customer expectations and University goals. • Research • Recruitment • Retention
SEM leadership & structure Missouri S&Teffective October 16, 2008
Enrollment Management Division • Registrar • Student Financial Assistance • Admissions and Visitor Center • New Student Programs (Orientation & IDs) • Student Diversity Programs • Women’s Leadership Institute • Center for Pre-College Programs • Project Lead the Way
The Core Understandings of Enrollment Management: • We exist to help and serve students the best we can • Be honest and positive at all times. Never feel pressure to make things up or answer questions you do not know the answers to. Feel free to say, “I don’t know, but I will find out and get back to you.” • You are the University – everything you say, how you look and act will be the guests vision and image of Missouri S&T. Take your role and the responsibility that goes with it very seriously.
Core Enrollment Management Performance Expectations Managerial Philosophy: Follow the “Platinum Rule” Do unto others as you would prefer them to do unto you Student Service Philosophy: Find ways to say “YES” Operational Philosophy: Make data based decisions & do the basics better than everyone else
Core enrollment principles • No Enrollment Effort is Successful without QUALITY Academic Programs to Promote • Recruitment and Retention is an On-going, Multi-year PROCESS with Strong Access to Research and DATA • +80% of Enrollments come from REGIONAL student markets for BS/BA degrees • The Most Successful Recruitment Programs Clearly DIFFERENTIATE the Student Experience from Competitor’s Programs • The Most Successful Retention Programs Clearly Address Students’ Needs and Regularly ENGAGE Students in Academic and Non-Academic Programs
One of America’s great universities • U.S. News: Best colleges as ranked by the High School Counselors at America’s Top 800 high schools: • Missouri S&T ranked 45th Overall • #12 public university • Ahead of, or tied with, every “Big 12” institution • #5 technological research university • #2 in Missouri behind Washington University
Rolla, Missouri“The Middle of Everywhere” SAFETY SAFETY SAFETY
One of America’s great universities A Top Public University Missouri S&T ranked 54th among the nation’s top public universities (U.S. News & World Report, 2008 America’s Best Colleges Guidebook, September 2008). Top 15 Public Colleges for Getting Rich #1 in the Midwest! Missouri S&T ranked 12th on Forbes magazine’s list of “Best Public Colleges for Getting Rich” (www.forbes.com, Aug. 2008) Top 20 STEM Research University Missouri S&T named in Academic Analytics’ “Top 20 Specialized Research Universities - STEM” (www.academicanalytics.com, Jan. 2008) Top 25 Starting Salaries #1 in the Midwest! Missouri S&T named in payscale.com’s list of highest average starting salaries for graduates (www.payscale.com, Aug. 2008) Top 25 Entrepreneurial Campus Missouri S&T ranked 22nd on Forbes ‘s list of “America’s Most Entrepreneurial Campuses” (www.forbes.com , Oct. 22, 2004). Top 25 Connected Campus Missouri S&T named in Princeton Review’s “America’s 25 Most Connected Campuses” (www.forbes.com, Jan. 19, 2006). Top 30 Safest College Campuses Missouri S&T ranked #27 in Reader’s Digest’s “Campus Safety Survey” (www.rd.com, 2008). Top 50 Engineering School Missouri S&T ranked 48th among the nation’s best engineering schools (U.S. News & World Report, 2007 America’s Best Colleges Guidebook, September 2006).
Building blocks of SEM “Data is a core to building and sustaining a strategic enrollment management program.” Alicia Moore SEM 2007, Central Oregon Community College
27% planning to submit fewer applications SOURCE: Longmire & Company, Inc. 2009 “Study of the Impact of the Economy on Enrollment”
Basic enrollment funnel Do not discount the value of funnel management and analysis ACT data makes the process much easier to engage on macro and micro levels
Projected change in high school graduates 2007-2017 +1 -17 -15 -23 -3 -19 +4 -14 -6 +13 -8 -12 -8 -14 -6 -6 -12 -6 -6 -2 +53 -6 -3 +10 -2 -4 +27 -6 +21 +9 -5 +1 +1 -3 +2 -31 +14 -1 +27 +1 +2 +1 -8 0 +22 0 > 20% +11% to +20% 0% to +10% Decreases -7 +16 +10 -9 -14 Source: Chronicle of Higher Education Almanac 2006-07
National vs.. Regional Trends WICHE, 2008
Increasing the college going rate is key WICHE, 2008
Labor Demand vs.. Student Interests Source: U.S. Department of Labor, Bureau of Labor Statistics, www.bls.gov/emp/home.htm
Change in Intended Major 1976-77 to 2006-07 College Board, 2007 Source: CIRP
20,000 fewer potential engineering majors College Bound ACT Tested Students Interested in Any Engineering Field > 5% SOURCE: ACT EIS 2008
Missouri’s 2008 student funnel for ALL engineering fields • High School Seniors: 72,467 • High School Graduates: 61,752 • ACT Testers/College Bound: 47,240 • Any Engineering Interest (all testers): 1,768 • Any Engineering Interest, (+21 testers): 1,256 (21 = MO average score / 50%) • Engineering Interest, +24 comp. score: 961 (24 = UM minimum for auto admission) • Missouri S&T Freshmen Engineering 681 Enrollees: 71% S&T market share SOURCES: MODESE 2009, ACT EIS 2008, PeopleSoft
2001-2008 college-bound senior ACT test takers with engineering interest and 24+
Missouri ACT score senders to S&T NEW CALL TO ACTION: STRESS IMPORTANCE OF FEMALE STUDENTS SENDING TEST SCORES
Percent For Whom Financing was a Major Concern 1992-93 to 2006-07 (Selected Years) College Board, 2007 Source: CIRP
68% of families plan to finance their child’s college education through cash generated from family income SOURCE: Longmire & Company, Inc. 2009 “Study of the Impact of the Economy on Enrollment”
35% increase in test senders with family incomes of $60,000+ SOURCE: ACT AIM, 2008
13% (+375) increase in FAFSA submissions over AY0925% (+641) increase in FAFAS submissions over AY07
Some Trends that have not Changed: The Golden Circle for Recruitment +70% enroll within 140 miles of home +80% enroll in home state DEMO
By 2012, Missouri will have 4,000 fewer high school graduates each year
FS2008 Missouri First Time College Freshman FS2008 First Time College Enrollees FS2008 First Time College Admits FS2008 First Time College Applicants FS2008 First Time College Inquiries
% change in Missouri population by county2000-2008 Missouri Average = 5.6% -14.4% - -0.1% 0% - 4.9% 5% - 9.9% 10% - 19.9% 20% - 39% Source: USDA, Bureau of the Census Published by: University of Missouri Extension, April 2 2009
Territory assignments: balancing service regions by interest density
Female Enrollments Exceed 57% of All College Students SOURCE: NCES, The Condition of Education 2006, pg. 36
FS2008 Domestic First Time College Freshman FS2008 First Time College Enrollees FS2008 First Time College Admits FS2008 First Time College Applicants FS2008 First Time College Inquiries