Download
1 / 44
440 likes | 603 Views
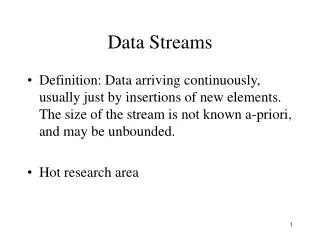
Surprise Detection in Science Data Streams. Kirk Borne Dept of Computational & Data Sciences George Mason University. kborne@gmu.edu , http://classweb.gmu.edu/kborne/. Outline. Astroinformatics Example Application: The LSST Project New Algorithm for Surprise Detection: KNN-DD. Outline.

E N D
Surprise Detection in Science Data Streams Kirk Borne Dept of Computational & Data Sciences George Mason University kborne@gmu.edu , http://classweb.gmu.edu/kborne/
Outline • Astroinformatics • Example Application: The LSST Project • New Algorithm for Surprise Detection: KNN-DD
Outline • Astroinformatics • Example Application: The LSST Project • New Algorithm for Surprise Detection: KNN-DD
Astronomy: Data-Driven Science = Evidence-based Forensic Science
From Data-Driven to Data-Intensive • Astronomy has always been a data-driven science • It is now a data-intensive science: welcome to Astroinformatics ! • Data-oriented Astronomical Research = “the 4th Paradigm” • Scientific KDD (Knowledge Discovery in Databases)
Astroinformatics Activities • Borne (2010): “Astroinformatics: Data-Oriented Astronomy Research and Education”, Journal of Earth Science Informatics, vol. 3, pp. 5-17. • Web home: http://www.practicalastroinformatics.org/ • Astro data mining papers: • “Scientific Data Mining in Astronomy” arXiv:0911.0505 • “Data Mining and Machine Learning in Astronomy” arXiv:0906.2173 • Virtual Observatory Data Mining Interest Group (contact longo@na.infn.it) • Astroinformatics Conference @ Caltech, June 16-19 (Astroinformatics2010) • NASA/Ames Conference on Intelligent Data Understanding @ October 5-7 • Astro2010 Decadal Survey Position Papers: • Astroinformatics: A 21st Century Approach to Astronomy • The Revolution in Astronomy Education: Data Science for the Masses • The Astronomical Information Sciences: Keystone for 21st-Century Astronomy • Wide-Field Astronomical Surveys in the Next Decade • Great Surveys of the Universe
From Data-Driven to Data-Intensive • Astronomy has always been a data-driven science • It is now a data-intensive science: welcome to Astroinformatics ! • Data-oriented Astronomical Research = “the 4th Paradigm” • Scientific KDD (Knowledge Discovery in Databases): • Characterize the known (clustering, unsupervised learning) • Assign the new (classification, supervised learning) • Discover the unknown (outlier detection, semi-supervised learning) • … Scientific Knowledge ! • Benefits of very large datasets: • best statistical analysis of “typical” events • automated search for “rare” events
Outlier Detection as Semi-supervised Learning Graphic from S. G. Djorgovski
Basic Astronomical Knowledge Problem • Outlier detection: (unknown unknowns) • Finding the objects and events that are outside the bounds of our expectations (outside known clusters) • These may be real scientific discoveries or garbage • Outlier detection is therefore useful for: • Novelty Discovery – is my Nobel prize waiting? • Anomaly Detection – is the detector system working? • Science Data Quality Assurance – is the data pipeline working? • How does one optimally find outliers in 103-D parameter space? or in interesting subspaces (in lower dimensions)? • How do we measure their “interestingness”?
Outlier Detection has many names • Outlier Detection • Novelty Detection • Anomaly Detection • Deviation Detection • SurpriseDetection
Outline • Astroinformatics • Example Application: The LSST Project • New Algorithm for Surprise Detection: KNN-DD
LSST = Large Synoptic Survey Telescope (mirror funded by private donors) 8.4-meter diameter primary mirror = 10 square degrees! http://www.lsst.org/ Hello ! (design, construction, and operations of telescope, observatory, and data system: NSF) (camera: DOE)
LSST Key Science Drivers: Mapping the Universe– Solar System Map (moving objects, NEOs, asteroids: census & tracking)– Nature of Dark Energy (distant supernovae, weak lensing, cosmology)– Optical transients (of all kinds, with alert notifications within 60 seconds)– Galactic Structure (proper motions, stellar populations, star streams, dark matter) LSST in time and space:– When? 2016-2026– Where? Cerro Pachon, Chile Model of LSST Observatory
Observing Strategy: One pair of images every 40 seconds for each spot on the sky, then continue across the sky continuously every night for 10 years (2016-2026), with time domain sampling in log(time) intervals (to capture dynamic range of transients). • LSST (Large Synoptic Survey Telescope): • Ten-year time series imaging of the night sky – mapping the Universe ! • 100,000 events each night – anything that goes bump in the night ! • Cosmic Cinematography! The New Sky! @ http://www.lsst.org/ Education and Public Outreach have been an integral and key feature of the project since the beginning – the EPO program includes formal Ed, informal Ed, Citizen Science projects, and Science Centers / Planetaria.
LSST Summaryhttp://www.lsst.org/ • Plan (pending Decadal Survey): commissioning in 2016 • 3-Gigapixel camera • One 6-Gigabyte image every 20 seconds • 30 Terabytes every night for 10 years • 100-Petabyte final image data archive anticipated – all data are public!!! • 20-Petabyte final database catalog anticipated • Real-Time Event Mining: 10,000-100,000 events per night, every night, for 10 yrs • Follow-up observations required to classify these • Repeat images of the entire night sky every 3 nights: Celestial Cinematography
The LSST will represent a 10K-100K times increase in the VOEvent network traffic.This poses significant real-time classification demands on the event stream:from data to knowledge!from sensors to sense!
MIPS model for Event Follow-up MIPS = Measurement – Inference – Prediction – Steering Heterogeneous Telescope Network = Global Network of Sensors: Similar projects in NASA, Earth Science, DOE, NOAA, Homeland Security, NSF DDDAS (voeventnet.org, skyalert.org) Machine Learning enables “IP” part of MIPS: Autonomous (or semi-autonomous) Classification Intelligent Data Understanding Rule-based Model-based Neural Networks Temporal Data Mining (Predictive Analytics) Markov Models Bayes Inference Engines
Example: The Thinking Telescope Reference: http://www.thinkingtelescopes.lanl.gov
From Sensors to Sense From Data to Knowledge: from sensors to sense (semantics) Data → Information → Knowledge
Outline • Astroinformatics • Example Application: The LSST Project • New Algorithm for Surprise Detection: KNN-DD (work done in collaboration Arun Vedachalam)
Experiment #1-A (L-TN) • Simple linear data stream – Test A • Is the red point an inlier or and outlier?
Experiment #1-B (L-SO) • Simple linear data stream – Test B • Is the red point an inlier or and outlier?
Experiment #1-C (L-HO) • Simple linear data stream – Test C • Is the red point an inlier or and outlier?
Experiment #2-A (V-TN) • Inverted V-shaped data stream – Test A • Is the red point an inlier or and outlier?
Experiment #2-B (V-SO) • Inverted V-shaped data stream – Test B • Is the red point an inlier or and outlier?
Experiment #2-C (V-HO) • Inverted V-shaped data stream – Test C • Is the red point an inlier or and outlier?
Experiment #3-A (C-TN) • Circular data topology – Test A • Is the red point an inlier or and outlier?
Experiment #3-B (C-SO) • Circular data topology – Test B • Is the red point an inlier or and outlier?
Experiment #3-C (C-HO) • Circular data topology – Test C • Is the red point an inlier or and outlier?
KNN-DD = K-Nearest Neighbors Data Distributions fK(d[xi,xj])
KNN-DD = K-Nearest Neighbors Data Distributions fO(d[xi,O])
KNN-DD = K-Nearest Neighbors Data Distributions fO(d[xi,O]) ≠ fK(d[xi,xj])
The Test: K-S test • Tests the Null Hypothesis: the two data distributions are drawn from the same parent population. • If the Null Hypothesis is rejected, then it is probable that the two data distributions are different. • This is our definition of an outlier: • The Null Hypothesis is rejected. Therefore… • the data point’s location in parameter space deviates in an improbable way from the rest of the data distribution.
Advantages and Benefits of KNN-DD • The K-S test is non-parametric • It makes no assumption about the shape of the data distribution or about “normal” behavior • It compares the cumulative distribution of the data values (inter-point distances)
Cumulative Data Distribution (K-S test) for Experiment 1A (L-TN)
Cumulative Data Distribution (K-S test) for Experiment 2B (V-SO)
Cumulative Data Distribution (K-S test) for Experiment 3C (C-HO)
Advantages and Benefits of KNN-DD • The K-S test is non-parametric • It makes no assumption about the shape of the data distribution or about “normal” behavior • KNN-DD: • operates on multivariate data (thus solving the curse of dimensionality) • is algorithmically univariate (by estimating a function that is based only on the distance between data points) • is computed only on a small-K local subsample of the full dataset N (K << N) • is easily parallelized when testing multiple data points for outlyingness
Results of KNN-DD experiments The K-S test p value is essentially the likelihood of the Null Hypothesis.
Results of KNN-DD experiments The K-S test p value is essentially the likelihood of the Null Hypothesis.
Future Work • Validate our choices of p and K • Measure the KNN-DD algorithm’s learning times • Determine the algorithm’s complexity • Compare the algorithm against several other outlier detection algorithms • Evaluate the algorithm’s effectiveness on much larger datasets • Demonstrate its usability on streaming data