Download
1 / 55
550 likes | 556 Views
This article discusses the Primal-Dual PCA method and its comparison with Singular Value Decomposition (SVD) for data analysis and representation. It includes toy examples, simulations, and insights into the structure of data. The article also explores the use of vectors and functions in high-dimensional visualization and the representation of shapes using PCA. Overall, it provides a comprehensive understanding of PCA and SVD in data analysis.

E N D
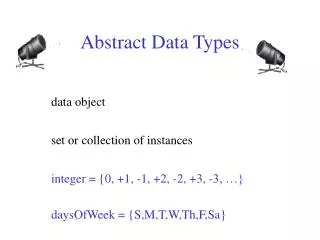
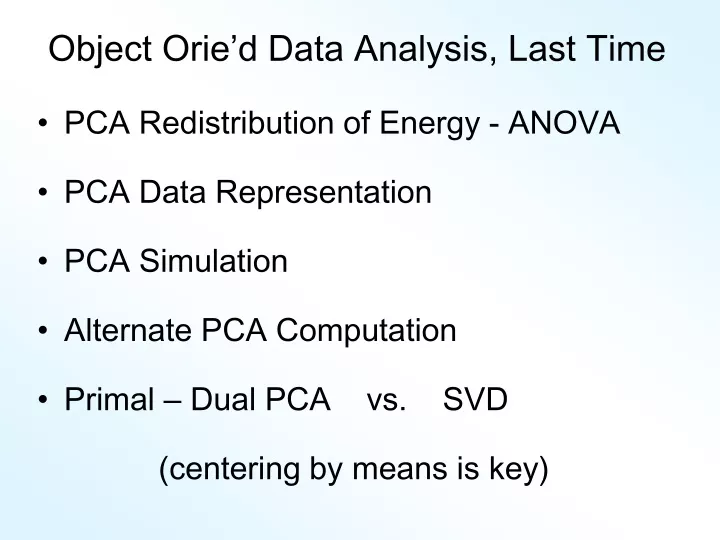
Object Orie’d Data Analysis, Last Time • PCA Redistribution of Energy - ANOVA • PCA Data Representation • PCA Simulation • Alternate PCA Computation • Primal – Dual PCA vs. SVD (centering by means is key)
Primal - Dual PCA Toy Example 3: Random Curves, all in Dual Space: • 1 * Constant Shift • 2 * Linear • 4 * Quadratic • 8 * Cubic (chosen to be orthonormal) • Plus (small) i.i.d. Gaussian noise • d = 40, n = 20
Primal - Dual PCA Toy Example 3: Raw Data
Primal - Dual PCA Toy Example 3: Raw Data • Similar Structure to e.g. 1 • But Rows and Columns trade places • And now cubics visually dominant (as expected)
Primal - Dual PCA Toy Example 3: Primal PCA Column Curves as Data Gaussian Noise Only 3 components Poly Scores (as expected)
Primal - Dual PCA Toy Example 3: Dual PCA Row Curves as Data Components as expected No Gram-Schmidt (since stronger signal)
Primal - Dual PCA Toy Example 3: SVD – Matrix-Image
Primal - Dual PCA Toy Example 4: Mystery #1
Primal - Dual PCA Toy Example 4: SVD – Curves View
Primal - Dual PCA Toy Example 4: SVD – Matrix-Image
Primal - Dual PCA Toy Example 4: Mystery #1 Structure: Primal - Dual Constant Gaussian Gaussian Linear Parabola Gaussian Gaussian Cubic • Nicely revealed by Full Matrix decomposition and views
Primal - Dual PCA Toy Example 5: Mystery #2
Primal - Dual PCA Toy Example 5: SVD – Curves View
Primal - Dual PCA Toy Example 5: SVD – Matrix-Image
Primal - Dual PCA Toy Example 5: Mystery #2 Structure: Primal - Dual Constant Linear Parabola Cubic Gaussian Gaussian Gaussian Gaussian • Visible via either curves, or matrices…
Primal - Dual PCA Is SVD (i.e. no mean centering) always “better”? What does “better” mean??? A definition: Provides most useful insights into data Others???
Primal - Dual PCA Toy Example where SVD is less informative: • Simple Two dimensional • Key is subtraction of mean is bad • I.e. Mean dir’n different from PC dir’ns • And Mean Less Informative
Primal - Dual PCA Toy Example where SVD is less informative: Raw Data
Primal - Dual PCA PC1 mode of variation (centered at mean): Yields useful major mode of variation
Primal - Dual PCA PC2 mode of variation (centered at mean): Informative second mode of variation
Primal - Dual PCA SV1 mode of variation (centered at 0): Unintuitive major mode of variation
Primal - Dual PCA SV2 mode of variation (centered at 0): Unintuitive second mode of variation
Primal - Dual PCA Summary of SVD: • Does give a decomposition • I.e. sum of two pieces is data • But not good insights about data structure • Since center point of analysis is far from center point of data • So mean strongly influences the impression of variation • Maybe better to keep these separate???
Primal - Dual PCA Bottom line on: Primal PCA vs. SVD vs. Dual PCA These are not comparable: • Each has situations where it is “best” • And where it is “worst” • Generally should consider all • And choose on basis of insights See work of Lingsong Zhang on this…
Vectors vs. Functions Recall overall structure: Object SpaceFeature Space Curves (functions) Vectors Connection 1: Digitization Parallel Coordinates Connection 2: Basis Representation
Vectors vs. Functions Connection 1: Digitization: Given a function , define vector Where is a suitable grid, e.g. equally spaced:
Vectors vs. Functions Connection 1: Parallel Coordinates: Given a vector , define a function where And linearly interpolate to “connect the dots” Proposed as High Dimensional Visualization Method by Inselberg (1985)
Vectors vs. Functions Parallel Coordinates: Given , define Now can “rescale argument” To get function on [0,1], evaluated at equally spaced grid
Vectors vs. Functions Bridge between vectors & functions: Vectors Functions Isometry follows from convergence of: Inner Products By Reimann Summation
Vectors vs. Functions Main lesson: - OK to think about functions - But actually work with vectors For me, there is little difference But there is a statistical theory, and mathematical statistical literature on this Start with Ramsay & Silverman (2005)
Vectors vs. Functions Recall overall structure: Object SpaceFeature Space Curves (functions) Vectors Connection 1: Digitization Parallel Coordinates Connection 2: Basis Representation
Vectors vs. Functions Connection 2: Basis Representations: Given an orthonormal basis (in function space) E.g. • Fourier • B-spline • Wavelet Represent functions as:
Vectors vs. Functions Connection 2: Basis Representations: Represent functions as: Bridge between discrete and continuous:
Vectors vs. Functions Connection 2: Basis Representations: Represent functions as: Finite dimensional approximation: Again there is mathematical statistical theory, based on (same ref.)
Vectors vs. Functions Repeat Main lesson: - OK to think about functions - But actually work with vectors For me, there is little difference (but only personal taste)
PCA for shapes New Data Set: Corpus Callossum Data • “Window” between right and left halves of the brain • From a vertical slice MR image of head • “Segmented” (ie. found boundary) • Shape is resulting closed curve • Have sample from n = 71 people • Feature vector of d = 80 coeffic’ts from Fourier boundary representation (closed curve)
PCA for shapes Raw Data: Special thanks to Sean Ho View curves as movie Modes of variation?
PCA for shapes PC1: Movie shows evolution along eigenvector Projections in bottom plot 2 Data Subclasses • Schizophrenics • Controls
PCA for shapes PC1 Summary (Corpus Callossum Data) • Direction is “overall bending” • Colors studied later (sub populations) • An outlier??? • Find it in the data? • Case 2: could delete & repeat (will study outliers in more detail)
PCA for shapes Raw Data: This time with numbers So can identify outlier
PCA for shapes PC2: Movie shows evolution along eigenvector Projections in bottom plot
PCA for shapes PC2 Summary (Corpus Callossum Data) • Rotation of right end • “Sharpening” of left end • “Location” of left end • These are correlated with each other • But independent of PC1
PCA for shapes PC3: Thin vs. fat Important mode of variation?
PCA for shapes Raw Data: Revisit to look for 3 modes • Bending • Endpts • Thinning
PCA for shapes Raw Data: Medial Repr’n Heart is Medial Atoms Spokes imply boundary Modes of Variation?
PCA for shapes PC1 Summary (medial representation) • From same data as above Fourier boundary rep’n • But they look different • Since different type of fitting was done • Also, worst outlier was deleted • Modes of variation?
PCA for shapes PC1: Overall Bending Same as for Fourier above Corr’d with right end fattening
PCA for shapes PC2: Rotation of ends Similar to PC2 of Fourier rep’n above
PCA for shapes PC3: Distortion of Curvature Different from PC2 of Fourier rep’n above
PCA for shapes PC3 Summary (medial representation) • Systematic “distortion of curvature” • This time different from above Fourier boundary PC3 • Lesson: different rep’ns focus on different aspects of data • I.e. not just differences in fitting • But instead on features that are emphasized • Thus choice of “features” is very important