Download
1 / 22
320 likes | 457 Views
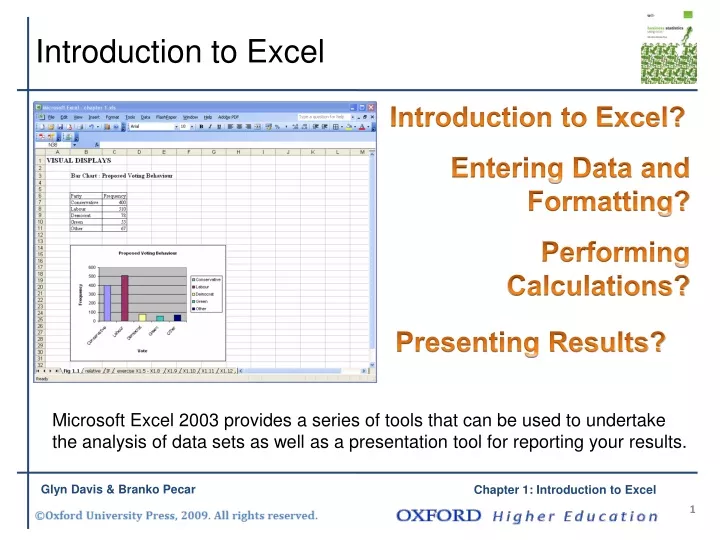
Introduction to Excel. Introduction to Excel?. Entering Data and Formatting?. Performing Calculations?. Presenting Results?. Microsoft Excel 2003 provides a series of tools that can be used to undertake the analysis of data sets as well as a presentation tool for reporting your results.

E N D
Introduction to Excel Introduction to Excel? Entering Data and Formatting? Performing Calculations? Presenting Results? Microsoft Excel 2003 provides a series of tools that can be used to undertake the analysis of data sets as well as a presentation tool for reporting your results. Glyn Davis & Branko Pecar 1
Learning Objectives • On successful completion of the module, you will be able to do the following. • Create a new Excel workbook and worksheets. • Save and close workbooks. • Format cells. • Select a cell. • Select a range of cells. • Enter data into a cell or a range of cells e.g. numbers, text. • Create and modify cell formulas. • Create and apply names to a cell range. • Print worksheets and workbooks and apply preview before printing worksheets. • Understand that Excel can create a table and chart. • Apply Excel functions to solve statistical problems. • Load Excel Analysis ToolPak add-in to solve a range of statistical problems. • Insert an Excel worksheet and chart into Microsoft Word. Glyn Davis & Branko Pecar 2
Introduction to Microsoft Excel Microsoft Excel provides a series of tools that can be used to undertake the analysis of data sets as well as a presentation tool for reporting your results. A spreadsheet is a table of cells arranged in rows and columns. The data values in each cell can take many forms, such as text, dates, times, and numbers (including currency and percentages). The relationships between cells are called formulae. If you change the value in a cell, the contents of any cells that depend on that value will change automatically. This enables you to study what-if scenarios. Excel can create and manipulate spreadsheets (which are called worksheets). It can also produce graphs (known as charts) and can link one worksheet to another. Glyn Davis & Branko Pecar 3
Components • Worksheets - Worksheets can be used to store, manipulate, calculate, analyse data, and create tables and charts. • Workbooks - These are a collection of sheets stored in the same file on the disk. By keeping related worksheets in the same workbook, it is easy to make simultaneous changes and edits to all workbook sheets at one time, or to consolidate related sheets or do calculations involving multiple sheets. Excel 2003 contains a maximum of 255 worksheets. • A row - A Row is a line of Horizontal cells within a spreadsheet e.g. A3, B3,C3, D3, E3 etc…Within each worksheet there are 65,536 Rows. • A column - A Column is a line of Vertical cells within a spreadsheet e.g. A1, A2, A3, A4, A5 etc…Within each worksheet there are 256 Columns. • A cell - A cell is the intersection of a Row and a Column, which has a unique address or reference. For example where Column C and Row 8 intersect is cell C8. You use cell references when you write formulas or refer to cells. Glyn Davis & Branko Pecar 4
Continued • Absolute cells - A reference such as $A$2 tells Excel how to find a cell based on the exact location of that cell in the worksheet. An absolute reference is designated by adding a dollar sign ($) before the column letter and the row number. • A range - A selection of multiple cells is referred to as a range. A single cell in some circumstances may represent a range. • Charts - Excel can create charts quickly to visually represent a data set stored in a worksheet. A range of chart types can be created, including: pie charts, bar charts, line graphs, and scattergrams. • Macros - Excel can be used to develop and store macros that can be used to undertake frequently applied tasks. This topic is beyond the scope of this text book. • Presentations - Excel has a range of drawing and formatting tools that can be used to create high quality presentations. These presentations can then be printed or copied to a word processing or presentation software package. Glyn Davis & Branko Pecar 5
Loading Excel Select Start > Programs > Office > Excel Glyn Davis & Branko Pecar 6
Task Panes Example of a task pane The Getting Started task pane provides easy ways of accessing Office information, creating new workbooks, and opening recently used workbooks. Office Assistant Excel Help Glyn Davis & Branko Pecar 7
Saving and Opening a Workbook Saving a Workbook Click on File > Save A Save As box will appear – give it a file name; name.XLS and save to a particular location. Opening a Workbook Click on File > Open (or click on ) Browse to the file that you wish to open and click on Open Glyn Davis & Branko Pecar 8
Other Basic Tasks Closing a workbook Click on File > Close Switch to a new worksheet Click on the tab at the bottom of the screen to select the next sheet. Creating a new worksheet Click on Insert > Worksheet Opening a new workbook Click on File > New Glyn Davis & Branko Pecar 9
Printing and Print Preview The print preview function allows you to preview your worksheet exactly as it will be printed. Click on the print preview button . A similar screen to that shown below will appear. You can print the document direct from the worksheet by clicking File > Print, or click on situated on the Excel menu bar. Glyn Davis & Branko Pecar 10
Entering Data and Formatting Data is entered into the worksheet by moving the cursor to the appropriate position on the screen, clicking the left mouse button to select the cell, and then typing the information required. The characters you type will then appear in the active cell and on the formula bar. When you have finished typing data into a cell you should signal the end of that data by pressing the enter key. Numeric values include only the digits 0-9 and some special characters such as: A numeric cell entry can maintain precision up to 15 digits. If you enter a number that is too long, Excel converts it to scientific notation. For example, if you type 97867985685859300, it will be stored as 97867985685859300, and displayed as 9.7868E+16. Excel will round the number off or display a string of # signs. A text entry can contain up to 32,767 characters but only 1024 characters will display in the cell but all will be displayed in the formula bar. Glyn Davis & Branko Pecar 11
Entering Data To enter data (or text). Select a cell in which you want to enter data. Type in the entry. The entry will appear in the formula bar as it is typed. To enter what you have typed press the Return key, or click on the green tick to enter. If you make a mistake then click in the cell and press the backspace key on the keyboard. To cancel a cell entry, click on the red cross before clicking on enter. Glyn Davis & Branko Pecar 12
Entering Numbers Numbers are constant values containing only the following characters: 1 2 3 4 5 6 7 8 9 0 - + / . E e £ $ % , ( ). Once a number has been entered into a cell, it may then be formatted by using the following buttons. Glyn Davis & Branko Pecar 13
Entering Dates and Times If you type a date or time (e.g. 13/4/8 or 16:21) directly into a cell, Excel should automatically recognise it as such and change the cell formatting from general to the appropriate date or time format. The program will normally align it to the right of the cell and display it in the formula bar in a standard format (e.g. 13/04/2008 or 16:21:00). Glyn Davis & Branko Pecar 14
Entering and Formatting Text To enter text, select a cell and type the text. A cell can hold up to 255 characters. You can format the characters within a cell individually but note that if there are more than 255 characters in the cell then the cell will show "#########". This problem can be resolved by applying text wrapping to the cell. We can format the text or numbers quite easily using the Excel formatting tools (see below). Align text Font size Column width Row height Font type Bold Italic Note. You can name a worksheet by right-clicking on the sheet tab and typing in a new name. Underline Glyn Davis & Branko Pecar 15
Further Formatting Options • Inserting and deleting rows and columns, e.g. • Insert row between row 8 and 9: Right-click on row 8 and Select Insert. • Insert a column between column B and C: Right-click on column B and Select Insert. Spell checking Excel allows you to check the spelling of your work. Select a cell with text and click the check spelling button on the toolbar. AutoFormat Excel has a number of built in table formats for you to choose from when formatting a table. Click on Format on Excel menu and choose AutoFormat. Glyn Davis & Branko Pecar 16
Performing Calculations Excel can be used to develop simple solutions to business data problems - mathematical, statistical, and financial. Using a formula you can perform operations, such as addition, multiplication, and comparison on worksheet values. Excel formulas always begin with an equal sign e.g. =7/8, =3*5+4/7, =3*A3, and =A3*A3. Glyn Davis & Branko Pecar 17
Absolute/Relative References The $ sign in a cell will tell Excel how to treat your references when copying the content of a cell. To illustrate this concept consider what happens to the following formulas in Cell C14 that are copied to D15. • =C14 becomes =D15 • =$C14 becomes =$C15 • =C$14 becomes =D$14 • =$C$14 becomes =$C$14 Glyn Davis & Branko Pecar 18
If and What If Analysis The IF function is very useful in solving numerical problems and enables the user to ask questions of the type ‘Is this true or false’ and then undertake a particular action. The technique can be illustrated by exploring the marks for two examination tests in which the tutor would like to find out which students obtained a higher mark for test 1 compared to test 2. This problem can be solved by using the Excel IF function: =IF(condition, value_if_true, value_if_false) Glyn Davis & Branko Pecar 19
Excel Analysis ToolPak Add-in Together with individual functions, Excel provides the Data Analysis ToolPak Add-in. To install this add-in Select Tools>Add-ins When installed you will find an extra menu on the Tools menu in Excel called Data Analysis. This will be used to conduct a range of statistical tests. Glyn Davis & Branko Pecar 20
Presenting Results • Excel solutions can be inserted into Microsoft Word. • This can include: • a worksheet • an area of a worksheet containing your Excel solution • an Excel chart. You can if you wish maintain a direct link (live) between the copied Excel content in your Word document and the Excel worksheet. Glyn Davis & Branko Pecar 21
Conclusion In this presentation we explored Excel 2003 and presented the key skills you will need to develop: Entering Data and Formatting Using Excel 2003 Performing Calculations Presenting Results Glyn Davis & Branko Pecar 22