Download
1 / 28
280 likes | 401 Views
0.04. A. C. Top 50 Ions From RF – 100% Accuracy . 0.02. -0.00. -0.02. -0.04. DIM 2. -0.06. Day 1_0Gy. Day 1_8Gy. 1.0. 0.8. -0.04. 0.00. -0.02. 0.04. 0.02. DIM 1. 0.6. S Plot. Upregulated in 8Gy Group. B. 0.4. 0.2. 0.0. -0.2. -0.4. -0.6. p( corr )[1]P (Correlation).

E N D
0.04 A C Top 50 Ions From RF – 100% Accuracy 0.02 -0.00 -0.02 -0.04 DIM 2 -0.06 Day 1_0Gy Day 1_8Gy 1.0 0.8 -0.04 0.00 -0.02 0.04 0.02 DIM 1 0.6 S Plot Upregulated in 8Gy Group B 0.4 0.2 0.0 -0.2 -0.4 -0.6 p(corr)[1]P (Correlation) -0.8 Colour Key -1.0 0.6 1 0.2 0.2 Day1_0Gy Day1_8Gy Downregulated in 8Gy Group -0.1 -0.2 0.1 0.2 0.0 p[1]P(Loadings)
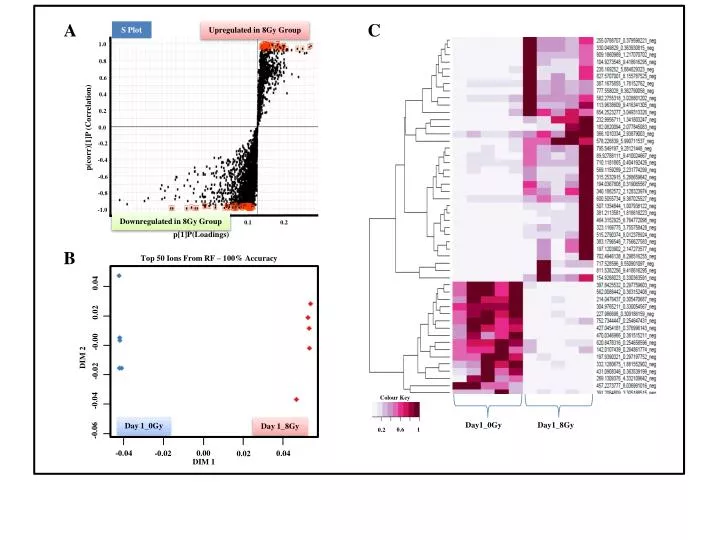
Supplementary Figure S1: UPLC-ESI-TOFMS GI metabolomics 1 day post-radiation exposure: CD2F1 mice were either sham irradiated or exposed to study 8Gy of γ radiation. The mice were euthanized 1 day, post-radiation exposure for blood and organ collection. Comparative metabolomic profiling of GI tissue was performed as described (see methods). Panel A. OPLS loadings S-plot comparing features from control GI (sham) with irradiated group. Panel B. Two dimensional accuracy plot for top 50 features interrogated using Random Forests. The X-axis denotes the interclass separation while the Y-axis displays the intra-class variability. Panel C. Heat map visualization of the feature rankings comparing relative levels in control and irradiated GI samples. Each row represents a unique feature with a characteristic mass to charge and retention time value.
Tissue Extract TOF MS/MS 203.11 ES- D-Tryptophan TOF MS/MS 203.11 ES- Supplementary Figure S2. Determination of chemical structure of metabolite (m/z 203.11) in GI tissue by tandem mass spectrometry. Top panel shows MS/MS fragmentation of the ion with m/z 203.11 from GI tissue extract, while the bottom panel shows the fragmentation for standard D-Tryptophan.
Tissue Extract TOF MS/MS 150.10 ES+ Tissue extract Methionine TOF MS/MS 150.10 ES+ standard Supplementary Figure S3. Determination of the chemical structure of metabolite (m/z = 150.10) in GI tissue by tandem mass spectrometry in electrospray positive mode. Top panel shows MS/MS fragmentation spectrum of the parent ion GI tissue extract while the bottom panel shows the fragmentation for standard methionine.
Tissue Extract TOF MS/MS 148.10 ES+ Glutamic acid TOF MS/MS 148.10 ES+ Supplementary Figure S4. Determination of the chemical structure of metabolite (m/z=148.10) in GI tissue by tandem mass spectrometry. Top panel shows MS/MS fragmentation spectrum of the parent ion from GI tissue extractwhile the bottom panel shows the fragmentation for standard Glutamic acid.
Cys-Gly TOF MS/MS 179.049 ES+ Tissue Extract TOF MS/MS 179.049 ES+ Supplementary Figure S5. Determination of the chemical structure of metabolite (m/z= 179.049) in GI tissue by tandem mass spectrometry. Top panel shows MS/MS fragmentation of the parent ion from GI tissue extractwhile bottom panel shows the fragmentation for standard Cys-Gly.
496.2751 Intensity 255.2361 409.2421 m/z Matched Unmatched Supplementary Figure S6. Determination of the chemical structure of lipid (PS(16:0/0:0)) with m/z 496.275 and retention time of 1.0176 minutes in GI tissue extracts by matching the fragmentation pattern with that obtained from the standard.
196.0404 452.2851 Intensity 140.0131 m/z Matched Unmatched Supplementary Figure S7. Determination of the chemical structure of lipid (PE(16:0/0:0)) in GI tissue by SimLipid 3.0 (Waters). tandem mass spectrometry with m/z 452.285 and RT 1.2883.
506.3342 Intensity 196.0404 140.0131 m/z Matched Unmatched Supplementary Figure S8. Determination of the chemical structure of lipid (PE(20:1/0:0)) in GI tissue by SimLipid 3.0 (Waters). tandem mass spectrometry with m/z 506.334 and RT 1.3263.
Supplementary Table ST1: Unidentified putative markers of IR exposure at Day 1.
Methionine (150.059_0.3822) Glutamic acid (148.061_0.3308) Cys-Gly (179.049_0.3636) LMGP02050002 (452.285_1.2883) LMGP03050002 (496.275_1.0176) Day 1_0Gy Day 1_4Gy Day 1_0Gy Day 1_8Gy Day 1_0Gy Day 1_8Gy Day 1_0Gy Day 1_8Gy Day 1_0Gy Day 1_4Gy LMGP01010612 (538.387_2.2977) LMGP01011254 (502.315_0.6916) D-Tryptophan (203.082_1.4182) LMGP02050020 (506.334_1.3263) Day 1_0Gy Day 1_0Gy Day 1_0Gy Day 1_4Gy Day 1_8Gy Day 1_8Gy Day 1_0Gy Day 1_8Gy Supplementary Figure S9. Box-and-whisker plots of putative biomarkers of radiation injury of GI tissue in CD2F1 mice. The features that were significantly altered in the irradiated GI tissue (4 & 8Gy) at day 1 were shortlisted via multivariate data analysis, putatively identified by accurate mass based search using Madison Metabolomics Consortium Database (MMCD) and confirmed by matching fragmentation pattern with standard compounds.
0.04 A C Top 50 Ions From RF – 100% Accuracy 0.02 -0.00 -0.02 -0.04 DIM 2 -0.06 Day 4_8Gy Day 4_0Gy 1.0 0.8 -0.04 0.00 -0.02 0.04 0.02 DIM 1 0.6 S Plot Upregulated in 8Gy Group B 0.4 0.2 0.0 -0.2 -0.4 -0.6 p(corr)[1]P (Correlation) -0.8 -1.0 Downregulated in 8Gy Group -0.1 -0.2 0.1 0.2 0.0 p[1]P(Loadings) Day4_0Gy Day4_8Gy
Supplementary Figure S10: UPLC-ESI-TOFMS based GI metabolomics at 4 days post-IR exposure: CD2F1 mice were either sham irradiated or exposed to study 8Gy of γ radiation and euthanized after 4 days. Comparative metabolomic profiling of GI tissue was performed as described (see methods). Panel A. OPLS loadings S-plot comparing features from sham with irradiated group. Panel B. Two dimensional accuracy plot for top 50 features interrogated using Random Forests. The X-axis denotes the interclass separation while the Y-axis displays the intra-class variability. Panel C. Heat map visualization of the feature rankings comparing relative levels in control and irradiated GI samples. Each row represents a unique feature with a characteristic mass to charge and retention time value.
Tissue Extract TOF MS/MS 146.20 ES+ Spermidine TOF MS/MS 146.20 ES+ Supplementary Figure S11. Determination of the chemical structure of metabolite (m/z = 146.20) by tandem mass spectrometry. Top panel shows MS/MS fragmentation spectrum of the parent ion from GI tissue extract while the bottom panel shows the fragmentation for standard spermidine.
Tissue Extract TOF MS/MS 311.16 ES+ Eicosenoic acid TOF MS/MS 311.16 ES+ Supplementary Figure S12. Determination of the chemical structure of metabolite (m/z = 311.16) by tandem mass spectrometry. Top panel shows MS/MS fragmentation spectrum of the parent ion with m/z 311.169 while the bottom panel shows the fragmentation for standard Eicosenoic acid.
Tissue Extract TOF MS/MS 606.06 ES- UDP-N-Acetyl-glucosamine TOF MS/MS 606.06 ES- Supplementary Figure S13. Determination of the chemical structure of metabolite (m/z = 606.0739) by tandem mass spectrometry. Top panel shows MS/MS fragmentation of the parent ion while the bottom panel shows the fragmentation pattern for standard UDP-N-Acetyl-glucosamine.
Tissue Extract TOF MS/MS 514.27 ES- Taurocholic acid TOF MS/MS 514.27 ES- Supplementary Figure S14. Determination of the chemical structure of metabolite (m/z = 514.27) by tandem mass spectrometry. Top panel shows MS/MS fragmentation of the parent ion while the bottom panel shows fragmentation pattern of standard Taurocholic acid.
778.5473 Intensity 742.5486 m/z Matched Unmatched Supplementary Figure S15. Determination of the chemical structure of lipid (PE(O-20:0/20:5)) in GI tissue by SimLipid 3.0 (Waters). tandem mass spectrometry with m/z 778.547 and RT 5.0338.
833.5335 241.0149 255.5363 Intensity 279.237 553.2868 m/z Matched Unmatched Supplementary Figure S16. Determination of the chemical structure of lipid (PI(18:2/16:0)) with m/z 833.534 and retention time of 4.3 minutes in GI tissue extracts by matching the fragmentation pattern with that obtained from the standard.
861.5652 241.0153 Intensity 281.2524 m/z Matched Unmatched Supplementary Figure S17. Determination of the chemical structure of lipid (PI(18:1/18:1)) in GI tissue by SimLipid 3.0 (Waters). tandem mass spectrometry with m/z 861.565 and RT 4.7912.
283.2679 437.2751 Intensity 599.3305 m/z Matched Unmatched Supplementary Figure S18. Determination of the chemical structure of lipid (PI(18:0/0:0)) with m/z 599.331 and retention time of 1.4 minutes in GI tissue extracts by matching the fragmentation pattern matching with the standard.
Supplementary Table ST2: Unidentified putative markers of IR exposure at Day 4.
LMGP06010847 (833.534_4.2999) Spermidine (146.166_0.2437) Taurocholic acid (514.285_3.1882) LMGP02020084 (778.574_5.0338) Day 4_0Gy Day 4_4Gy Day 4_0Gy Day 4_8Gy Day 4_0Gy Day 4_4Gy Day 4_0Gy Day 4_4Gy LMGP06010002 (861.565_4.7912) LMGP06050004 (599.331_1.4042) Eicosenoic acid (311.169_0.1542) LMGP02050011 (476.287_1.0965) UDP (606.077_0.3992) Day 4_0Gy Day 4_8Gy Day 4_8Gy Day 4_8Gy Day 4_0Gy Day 4_0Gy Day 4_8Gy Day 4_0Gy Day 4_0Gy Day 4_4Gy Supplementary Figure S19: Box-and-whisker plots of putative biomarkers of IR injury of GI tissue in CD2F1 mice. The features that were significantly altered after 4 days of IR exposure were shortlisted via multivariate data analysis, putatively identified by accurate mass based search using Madison Metabolomics Consortium Database (MMCD) and confirmed by matching fragmentation pattern with standard compounds.
Panel A: Day 1 0GY 4GY 8GY Panel B: Day 4 0GY 4GY 8GY Supplementary Figure S20. Global metabolome visualization of GI tissue in sham or IR treated CD2F1 mice. Panels A and B. Self-organizing Maps (SOMs) reveal the effect of IR exposure after 1 and 4 days respectively. The data were acquired by UPLC-QTOF MS, pre-processed using XCMS and the feature intensities were normalized to internal standards and to total protein concentration. Top 100 features were used to construct SOMs which create a series of coherent mosaic heat maps representing overall ion profile in each sample. Tiles containing the highest-abundance ions are shaded in deep red, while those containing low abundance ions are shaded deep blue. The areas highlighted in black boxes show the change in the intensity of metabolites in GI tissue in a time and dose dependent manner.
Supplementary Table ST3: Functional pathway analysis of canonical pathways enriched in response to IR exposure
0.04 100 A C 0.02 80 -0.00 60 -0.02 40 -0.04 20 RF Accuracy [%] DIM 2 -0.06 0 Day 1_4Gy_Kidney Day 1_4Gy_GI 20 -0.04 60 0.00 40 -0.02 100 0.04 0.02 80 DIM 1 Number of variables Top 50 Ions From RF – 100% Accuracy B Colour Key 0.6 1 0.2 0.2 Day1_4Gy_GI Day1_4Gy_Kidney
Supplementary Figure S21: UPLC-ESI-TOFMS based comparative metabolomic profiling of GI and Kidney tissue at 4 days, post-IR exposure: CD2F1 mice were either sham irradiated or exposed to 4Gy of γ radiation and euthanized after 4 days. Panel A. Two dimensional separation plot for top 50 features interrogated using Random Forests. Panel B. Normalized accuracy plot showing unambiguous separation of the two groups Panel C. Heat map visualization of feature rankings comparing relative levels in the irradiated GI and Kidney tissue. Each row represents a unique feature with a characteristic mass to charge and retention time value.
Supplementary Table ST4. Putative serum biomarkers of radiation injury in C57BL6 mice irradiated with 4 & 8 Gy gamma radiation after 1 and four days respectively.