Download
1 / 26
260 likes | 430 Views
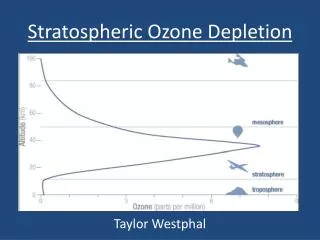
Interannual Variability in Stratospheric Ozone. Xun Jiang Advisor: Yuk L. Yung. Department of Environmental Science and Engineering California Institute of Technology 11/8/2006. Overview. Ozone: Observations and Models Tropics: QBO, QBO-AB, Solar Cycle, ENSO, MJO

E N D
Interannual Variability in Stratospheric Ozone Xun Jiang Advisor: Yuk L. Yung Department of Environmental Science and Engineering California Institute of Technology 11/8/2006
Overview • Ozone: Observations and Models • Tropics: QBO, QBO-AB, Solar Cycle, ENSO, MJO • High Latitudes: Annular Modes
Data and Models • Data • Merged O3 Data (MOD) [McPeters et al., 1996] • Assimilated O3 from European Centre for Medium-Range Weather Forecasts (ECMWF) [Uppala et al., 2005] • Models • 2-D Caltech/JPL Chemistry and Transport Model • 2-D Interactive Chemistry and Transport Model • 3-D GEOS-4 Chemistry-Climate Model
Principal Component Analysis (PCA) (N timesteps M stations ) Covariance Matrix ( M M ) EOFs ( e, Eigenvectors of C ): modes of spatial pattern PCs (p, ): time-dependent amplitudes of the EOFs Eigenvalue: the fraction of variance captured by each EOF The original data can be represented by To make EOF patterns have dimensional units. We multiply each EOF by the square root of their associated eigenvalue, and divide each PC by this value.
EOFs Cumul. Var. 42% QBO R=0.80 Decadal PCs Amplitude Spectra Tropical IAV in the Column Ozone from MOD [Camp et al., 2003]
Amplitude Spectra EOFs PCs Cumul. Var. 42% 75% 90% Tropical IAV in the Column Ozone from MOD [Camp et al., 2003] R=0.80 R=0.73 R=0.71 93%
Tropical IAV in the Column Ozone from Model [Jiang et al., 2004] • Mean meridional circulation and eddy mixing coefficients derived from the NCEP/DOE Reanalysis 2 (NCEP2). • The first realistic simulation of the QBO and QBO-Annual Beat (QBO-AB) in column ozone from 1979 to 2002. • The model ozone results for QBO and QBO-AB are compared to the signals obtained by the zonal mean MOD observations.
Tropical IAV in the Column Ozone from Model [Jiang et al., 2004] Composite of Column Ozone from 1979 to 2002 MOD 2D CTM
Tropical IAV in the Column Ozone from Model [Jiang et al., 2004] Latitude distribution of ozone anomaly DU MOD DU 2D CTM
Tropical IAV in the Column Ozone from Model Ozone PCA: 2D CTM and Zonal MOD [Jiang et al., 2004] EOFs PCs Power Spectra Cumul. Var. R=0.87 QBO 74% R=0.5 QBO-AB 85% Model (Solid) & MOD (Dash)
Quasi-biennial Oscillation-Annual Beat of Ozone [Jiang et al., 2005] • An idealized 2-D chemistry and transport model is used to investigate the spatial patterns and propagation the QBO-annual beat (QBO-AB) signal in ozone in the tropics and subtropics • An extended EOF analysis is used to study the propagation of QBO and QBO-AB. The model results are compared to those from the Merged Ozone Data (MOD).
Model Description and Data • I: Model: • Fully interactive model • Comprehensive treatment of stratospheric chemistry • The QBO is produced by the parameterization for the deposition of Kelvin and Rossby-gravity wave momentum in the tropical zonal wind. • II: Merged Ozone Volume Mixing Ratio Data
Propagation of QBO and QBO-AB (Model) PC1EEOF1+ PC2EEOF2 at equator PC3EEOF3+ PC4EEOF4 at 12.5 N
Propagation of QBO and QBO-AB (Data) PC1EEOF1+ PC2EEOF2 at equator PC3EEOF3+ PC4EEOF4 at 12.5 N
High Latitude IAV of Combined Column O3 in NH Cor. Coeff. 1st 0.53 30.4%
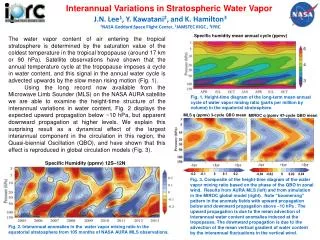
3.5-year Signal in the Arosa Ozone • Arosa (46N, 9E) column ozone time series (Aug. 1931 ~ Dec. 2002) • Signals in Spectra: • 3.5 years, QBO-AB, QBO
High Latitude IAV of Combined Column O3 in SH Cor. Coeff. 1st 0.45 43.9%
Comparison with a 3-D Chemistry-Climate Model • Model • Chemistry module on-line in the general circulation model [Douglass et al., 2003; Stolarski et al., 2006a; Bloom et al., 2005] • Sea surface temperature and sea ice are from observations • No solar cycle, volcanic aerosol, and QBO in the model. • Leading modes for the model O3 in the two hemispheres • ENSO signals in TOMS and model O3
Leading Mode in NH Data 30.4% Model 31.8%
Leading Mode in SH Data 43.9% Model 59.5%
ENSO in TOMS and 3-D Chemistry-Climate Model TOMS Model
PC timeseries of O3 in Tropics Cor. Coeff. TOMS 0.76 Model 0.53
Conclusions • The 2-D CTM provides realistic simulations of the IAV of ozone in the tropics. The QBO and QBO-Annual Beat are well captured in the Catech/JPL model. • An extended EOF analysis reveals the characteristic pattern of the downward propagation of QBO and upward propagation of QBO-AB, which is simulated well by a 2-D interactive CTM. • In the high latitudes, first modes are nearly zonally symmetric and represent the connections to the Annular Modes and the Quasi-Biennial Oscillation. • 3-D GEOS-4 chemistry-climate model can simulate the ozone trend reasonably well in both hemispheres. Model cannot simulate the low-frequency oscillations well. • 3-D Model captures ENSO signal well in the tropics. Some discrepancies for the model ENSO signal in the SH.