Download

1 / 14
140 likes | 315 Views
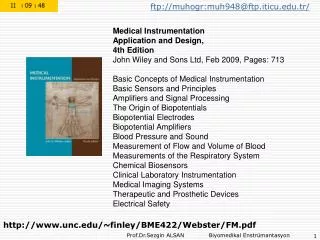
ME 322: Instrumentation Lecture 20. March 7, 2014 Professor Miles Greiner. Announcements/Reminders. I apologize that I didn’t make sure DAQmx was installed in the ECC You may turn in the L7PP on Monday, if necessary. It should be fully operational this weekend. HW 7 due now

E N D
ME 322: InstrumentationLecture 20 March 7, 2014 Professor Miles Greiner
Announcements/Reminders • I apologize that I didn’t make sure DAQmx was installed in the ECC • You may turn in the L7PP on Monday, if necessary. • It should be fully operational this weekend. • HW 7 due now • HW 8 Due next Friday • Then Spring Break! • Please fully participate in each lab and complete the Lab Preparation Problems • For the final you will repeat one of the last four labs, solo, including performing the measurements, and writing Excel, LabVIEW and PowerPoint.
A/D Converter Characteristics • Full-scale range VRL ≤ V ≤ VRU • FS = VRU- VRL • For myDAQthe user can chose between two ranges • ±10 V, ±2 V (FS = 4 or 20 V) • Number of Bits N • Resolves full-scale range into 2N sub-ranges • Smallest voltage change a conditioner can detect: • DV = FS/2N • For myDAQ, N = 16, 216 = 65,536 • ±10 V scale: DV = 0.000,31 V = 0.31 mV = 310 mV • ±2 V scale: DV = 0.000,076V = 0.076mV = 76 mV • Sampling Rate fS = 1/TS • For myDAQ, (fS)MAX = 200,000 Hz, TS = 5 msec
Input Resolution Error • The reported voltage is the center of the digitization sub-range in which the measured voltage is found to reside. • So the maximum error is half the sub-range size. • Inside the FS voltage range • At edge or outside of FS range • To avoid this, estimate the range of voltage that must be measured before conducting an experiment, and choose appropriate A/D converter and/or signal conditioners. • The IRE is the uncertainty caused by the digitization process
myDAQ Uncertainties • What are these? • AA: Maximum error of the voltage measurement reported by the manufacturer for all voltage levels • At different temperatures • MSVE: Maximum error measured at V = 0V for one device • IRE: Random error due to digitization process • Which one do you think characterizes voltage uncertainty?
Lab 7 Boiling Water Temperature in Reno • Water temperature uncertainty • Standard TC wire uncertainty • Larger of 2.2°C or 0.75% of measurement • Note: 0.0075 x 293°C = 2.2°C • wTC= 2.2°C • For ±10 Volts, measured shorted voltage uncertainty MSVU = 0.0024V • For signal conditioner SSC = 0.025 V/°C • wTsc= MSVU/SSC = 0.0024V/0.025 V/°C = 0.096°C • 2.202°C ~ 2.2°C
A/D Converters can be used to measure a long series of very rapidly changing voltage • Great for measuring a voltage signal • Would be very difficult using a regular voltmeter • Allows determination of Rates of Change and Spectral (Frequency) Content • The voltage and time associated with each measurement has some error • It is associated with the centers of the voltage sub-range and sampling time. • Additional systematic and random errors as well • What can go wrong?
Example • A small thermocouple at initial temperature Ti is placed in boiling water at temperature TB • Its measured temperature versus time T(t) is shown • What caused the temperature to change? • What do you expect the time-dependent heat-transfer rate to the thermocouple [joules/sec = watts] to look like qualitatively? • How can we determine it quantitatively? Ti TB T(t)
1st Law of Thermodynamics • How to estimate a time-derivative from a table of T versus t data? • is the samplingtime step [sec] (TS) • First order numerical differentiation • Centered differencing • is the differentiation time step [sec] • , m = integer (1, 2, or ?) • What is the best value for m (1, 10, 20, ?)
Sample Data • Lab 9 Transient Thermocouple Measurements • Download sample data • http://wolfweb.unr.edu/homepage/greiner/teaching/MECH322Instrumentation/Labs/Lab%2009%20TransientTCResponse/LabIndex.htm • Plot T vs t for t < 2 sec • Show how to evaluate and plot derivatives with different differentiation time steps • Plot dT/dt vs t for m = 1, 10, 50 • Slow T vs t for 0.95 s< t < 1.05 s and 20°C < T < 50°C • How do random errors affect “local” and “time averaged” slopes?
Effect of Random Noise • Measured voltage has real and noise components • VM = VR+VN • For small is large and random • Want • wV decreases as FS gets smaller and N increases • Want to be large enough to avoid random error but small enough to capture real events RF, IRF, other errors
T TB Ti t = 0 t
Example A/D N= 2 ±10V Interpret: