Download
1 / 26
270 likes | 502 Views
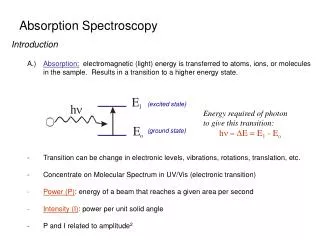
Visible and IR Absorption Spectroscopy. Andrew Rouff and Kyle Chau. The Basics. wavelength= (λ) original intensity= Ι o sample slab thickness= dl Final intensity= I f ε ’ = molar extinction coefficient -d I = Cε ’ (λ) I dl. How we get Absorbance. -dΙ= Cε ’ (λ) I dl

E N D
Visible and IR Absorption Spectroscopy Andrew Rouff and Kyle Chau
The Basics wavelength= (λ) original intensity= Ιo sample slab thickness= dl Final intensity= If ε’= molar extinction coefficient -dI= Cε’(λ)Idl
How we get Absorbance • -dΙ= Cε’(λ)Idl • ln(Ιo/Ιf)= Cε’(λ)l • log(Ιo/Ιf)= Cε’(λ)l= A(λ) A(λ) is known as absorbance or Optical Density (OD) When A(λ)= 3….1000=(Ιo/Ιf) When A(λ)= 4….10000= (Ιo/Ιf) Absorbance must be much lower than these to get any usable data
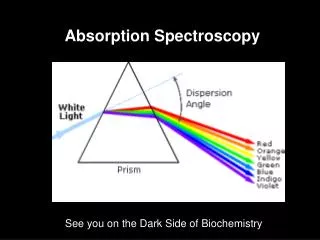
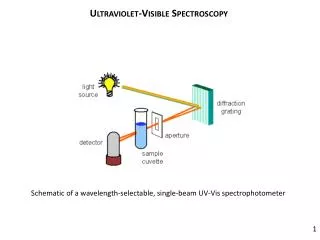
From Energy to Wavelength UV visible spectrum responds to energies between 100-1000kJ mole-1 frequency range= 2.5e14- 2.5e15 Wavelength range= 1.2e-6m- 1.2e-7m= 120nm-1200nm E=hf E= energy h= planck's constant f= frequency c= fλ c= speed of light
Macromolecules Studied in Water Water absorbs 170nm wavelength, so measurements must be made above this wavelength UV is largest change in energy, which is why we use it to measure absorbance. Vibrational and rotational are two small of a change to measure
Kinetics and Difference Spectra Kinetics A+B→ C Measuring the absorbance of C vs time gives information about A and B Difference Spectra Two absorbance graphs are subtracted from each other
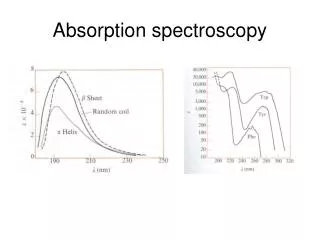
UV Absorption of Proteins Main absorption areas peptide group- 170-220nm Aromatics- 280nm Prosthetic groups, cofactors, enzymes, etc- vary Can use Absorbance to calculate concentration (first equation)
Light Scattering Has a “tail” because of light scattering Can either set zero higher up (done here), or graph can simply be fixed to have zero absorbance at end
Flash Photolysis Bond is broken by laser flash re-binding kinetics are followed through changes in absorption spectrum Graph shows absorption is higher when bond was broken
Bacteriorhodopsin Green light (569nm) initiates cycle Each letter represents a change in absorbance, and a shape change M has two shapes with the same absorbance
Bacteriorhodopsin is a light activated Proton Pump When it is in the dark, retinal configuration is all trans except for one cis configuration (dark adapted state) When light hits, the cis carbon turns trans, and the photocycle begins (light adapted state) The “Schiff” base changes configuration as the absorbance increases L to M shape change causes a loss of a hydrogen M to N shape change causes a gain of a hydrogen K shape causes carbon to go back to cis O shape causes it to go back to trans This is directly related to how we detect light
Nucleic Acids Different absorption peaks than in proteins Base causes the greatest absorbance- 260-290nm DNA and protein together in a sample will give at least two distinct absorption peaks
Melted DNA Extinction coefficient of nucleic acid is smaller than that of free nucleotide This means that absorbance increases when DNA is melted Hyperchromic effect- the increase in absorbance upon DNA denaturing
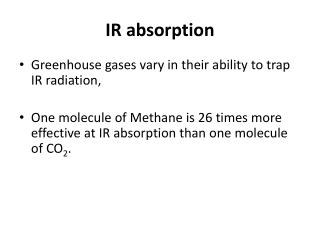
Infrared Absorption Spectroscopy • IR photons have low energy. • The only transitions that have comparable energy differences are molecular vibrations and rotations. • Triggering molecular vibrations through irradiation with infrared light. Provides mostly information about the presence or absence of certain functional groups.
Vibrational Mode • Stretching - the rhythmic movement along a bond axis with a subsequent increase and decrease in bond length. • Bending - a change in bond angle or movement of a group of atoms with respect to the rest of the molecule.
Application • Used to identify organic compounds • Provides information about the types of bonds present • Used to measure the vibrational frequencies of bonds in the molecule • Each bond has a characteristic frequency
Infrared Spectrum • A plot of % transmittance vs vibrational frequency in wavenumbers. • The higher the wavenumber, the shorter the wavelength.
FTIR Spectrophotometers • Uses an interferometer and polychromatic light (all frequencies used at one time, instead of one at a time) to generate an interferogram.
IR Difference Spectrum • IR spectra are very sensitive to structural alteration • A change in hydrogen bonding distance of 0.002Å shifts the frequency • However, it is very difficult, in practice, to detect small, localised structural changes in a biological macromolecule, by IR spectroscopy. • All groups in the molecule essentially have IR-active vibrations • Multitude of overlapping spectral bands
IR Spectroscopy and Water • Water peak at 3000-3700 cm-1