Download
1 / 45
450 likes | 604 Views
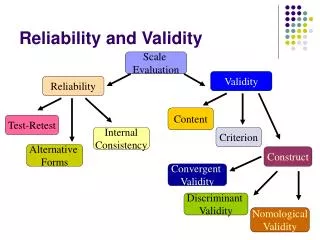
Primer on Evaluating Reliability and Validity of Multi-Item Scales. Questionnaire Design and Testing Workshop October 25, 2013, 3:30-5:00pm 10940 Wilshire Blvd. Suite 710 Los Angeles, CA. www.nihpromis.org. Patient Reported Outcomes Measurement Information System (PROMIS®)

E N D
Primer on Evaluating Reliability and Validity of Multi-Item Scales Questionnaire Design and Testing Workshop October 25, 2013, 3:30-5:00pm 10940 Wilshire Blvd. Suite 710 Los Angeles, CA
www.nihpromis.org • Patient Reported Outcomes Measurement Information System (PROMIS®) • Funded by the National Institutes of Health • One domain captured is “anger” • Mood (irritability, frustration) • Negative social cognitions (interpersonal sensitivity, envy, disagreeableness) • Needing to control anger
Item Responses and Trait Levels Person 1 Person 2 Person 3 Trait Continuum Item 1 Item 2 Item 3 www.nihpromis.org
Standard Error of Measurement (SEM) SEM = SD (1- reliability)1/2 95% CI = true score +/- 1.96 x SEM If z-score = 0 and reliability = 0.90 CI: -.62 to +.62 (width is 1.24 z-score units)
Reliability (0-1) • 0.70 or above for group comparisons • 0.90 or above for individual assessment z-scores (mean = 0 and SD = 1): • Reliability = 1 – SE2 • So reliability = 0.90 when SE = 0.32 T-scores (mean = 50 and SD = 10): • Reliability = 1 – (SE/10)2 • So reliability = 0.90 when SE = 3.2 T =50 + (z * 10)
In the past 7 days … I was grouchy [1st question] • Never [39] • Rarely [48] • Sometimes [56] • Often [64] • Always [72] Theta = 56.1 SE = 5.7 (rel. = 0.68)
In the past 7 days … I felt like I was ready to explode [2nd question] • Never • Rarely • Sometimes • Often • Always Theta = 51.9 SE = 4.8 (rel. = 0.77)
In the past 7 days … I felt angry [3rd question] • Never • Rarely • Sometimes • Often • Always Theta = 50.5 SE = 3.9 (rel. = 0.85)
In the past 7 days … I felt angrier than I thought I should [4th question] - Never • Rarely • Sometimes • Often • Always Theta = 48.8 SE = 3.6 (rel. = 0.87)
In the past 7 days … I felt annoyed [5th question] • Never • Rarely • Sometimes • Often • Always Theta = 50.1 SE = 3.2 (rel. = 0.90)
In the past 7 days … I made myself angry about something just by thinking about it. [6th question] • Never • Rarely • Sometimes • Often • Always Theta = 50.2 SE = 2.8 (rel = 0.92)
Theta, SEM, and 95% CI • 56 and 6 (reliability = .68) W = 22 • 52 and 5 (reliability = .77) W = 19 • 50 and 4 (reliability = .85) W = 15 • 49 and 4 (reliability = .87) W = 14 • 50 and 3 (reliability = .90) W = 12 • 50 and <3 (reliability = .92) W = 11
The following items are activities you might do during a typical day. Does your health limit you in these activities? • Vigorous activities, such as running, lifting heavy objects, participating in strenuous sports • Moderate activities, such as moving a table, pushing a vacuum cleaner, bowling, or playing golf • Lifting or carrying groceries • Climbing several flights of stairs • Climbing 1 flight of stairs • Bending, kneeling, or stooping • Walking more than a mile. • Walking several blocks. • Walking 1 block • Bathing or dressing yourself. No, not limited at all Yes, limited a little Yes, limited a lot
11. In the past 4 weeks, to what extent did health problems limit you in your everyday physical activities (e.g., walking and climbing stairs) • Not at all • Slightly • Moderately • Quite a bit • Extremely
12. How satisfied are you with your physical ability to do what you want to do? • Completely satisfied • Very satisfied • Somewhat satisfied • Somewhat dissatisfied • Very dissatisfied • Completely dissatisfied
13. When you travel around your community, does someone have to assist you because of your health? • Yes, all of the time • Yes, most of the time • Yes, some of the time • Yes, a little of the time • No, none of the time
14. Are you in bed or in a chair most or all of the day because of your health? • Yes, every day • Yes, most days • Yes, some days • Yes, occasionally • No, never
15. Are you able to use public transportation? • No, because of my health • No, for some other reason • Yes, able to use public transportation
Comparative Fit Index = 0.95; Root Mean Square Error of Approximation = 0.12 (Cronbach’scoefficent alpha = 0.94)
In the past 4 weeks, did health problems limit you in your everyday physical activities?
Evaluating Validity Cohen effect size rules of thumb (d = 0.2, 0.5, and 0.8): Small correlation = 0.100 Medium correlation = 0.243 Large correlation = 0.371 r = d / [(d2 + 4).5] = 0.8 / [(0.82 + 4).5] = 0.8 / [(0.64 + 4).5] = 0.8 / [( 4.64).5] = 0.8 / 2.154 = 0.371 . Note: Often r’s of 0.10, 0.30 and 0.50 are cited as small, medium, and large.
Change on SF-36 Physical Functioning Scale by Self-reported Retrospective Rating of Change Note: Cell entries in the same row that share a letter do not differ significantly (p > 0.05) from one another (Duncan’s multiple range tests). SD of change was 7.74 for 12 months and 7.08 for 6 months.
Questions? Powerpoint file posted at URL below (freely available for you to use, copy or burn): http://gim.med.ucla.edu/FacultyPages/Hays/ Contact information: drhays@ucla.edu 310-794-2294 For a good time call 867-5309 or go to: http://twitter.com/RonDHays
Appendix 1: For more information Hays, R. D., Morales, L. S., & Reise, S. P. (2000). Item Response Theory and Health Outcomes Measurement in the 21st Century. Medical Care, 38 (Suppl.), II-28-II-42. Hays, R. D., Liu, H., Spritzer, K., & Cella, D. (2007). Item response theory analyses of physical functioning items in the Medical Outcomes Study. Medical Care, 45, S32-38. Cella, D., Riley, W., Stone, A., Rothrock, N., Reeve, B., Young, S., Amtmann, D., Bode, R., Buysse, D., Choi, S., Cook, K., DeVellis, R., DeWalt, D., Fries, J. F., Gershon, R., Hahn, E. A., Pilkonis, P., Revicki, D., Rose, M., Weinfurt, K., Lai, J., & Hays, R. D. (2010). Initial item banks and first wave testing of the Patient-Reported Outcomes Measurement Information System (PROMIS) network: 2005-2008. Journal of Clinical Epidemiology, 63 (11), 1179-1194.
Appendix 2: Item Response Theory (IRT) • IRT models the relationship between a person’s response Yi to the question (i) and his or her level of the latent construct being measured by positing bik estimates how difficult it is for the item (i) to have a score of k or more and the discrimination parameter ai estimates the discriminatory power of the item.
Appendix 3: IntraclassCorrelation and Reliability Model Reliability Intraclass Correlation One-way Two-way fixed Two-way random BMS = Between Ratee Mean Square N = n of ratees WMS = Within Mean Square k = n of items or raters JMS = Item or Rater Mean Square EMS = Ratee x Item (Rater) Mean Square 44
Appendix 4: Confirmatory Factor Analysis Fit Indices 2 2 - • Normed fit index: • Non-normed fit index: • Comparative fit index: null model 2 2 2 null - model null df df null model 2 null - 1 df null 2 -df 1 - model model 2 - df null null RMSEA = SQRT (λ2 – df)/SQRT (df (N – 1))