Download

1 / 42
420 likes | 526 Views
BEYOND THE BELL & BEHIND THE DOOR: Multisite Evaluation of the Implementation and Impact of Supplemental Educational Services (SES). February 2011. Research team. Principal investigators : Patricia Burch, Carolyn Heinrich, Robert Meyer Research team members :

E N D
BEYOND THE BELL & BEHIND THE DOOR: Multisite Evaluation of the Implementation and Impact of Supplemental Educational Services(SES) February 2011
Research team Principal investigators: Patricia Burch, Carolyn Heinrich, Robert Meyer Research team members: Current: Rodolfo Acosta, Annalee Good, Mary Stewart,, Nidhi Mehrotra, Kim Jones, Huiping Cheng, Martina Chura, Nate Inglis-Steinfield, Hyun Sik Kim, Anne Ware and Angelica Ware Herrara Former: Holden Weisman, Jason Beach, Hiren Nisar Renee Timberlake
Research resources Funder: Institute for Educational Sciences, PR/Award number: R305A090301, Education Policy, Finance, and Systems Research Program, Goal 3 Study web page: http://sesiq2.wceruw.org
Outline of presentation • Study goals and research questions • Research design and data collection • Statistical methods for impact estimation • Empirical analysis of SES registration and attendance • Quantitative analysis findings • Qualitative analysis findings • Next steps in multisite study
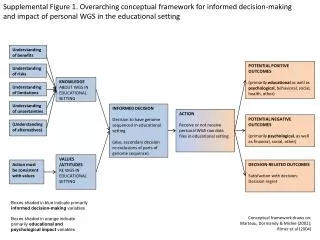
Overarching study questions • What is the impact of SES on student achievement? • What are key characteristics of different program models and formats of SES tutoring, and how do they influence SES program impacts? • What policy levers and program administration variables can be used to increase SES program effectiveness?
Research design • Longitudinal mixed-methods, multisite study with qualitative and quantitative study components • In-depth field research on tutoring practices and program administration • Quantitative estimation of program impacts and provider-specific effects in multiple program years • 5 urban school districts in 4 states: Austin, Dallas, Milwaukee, Minneapolis, Chicago
Qualitative data collection • Observations of tutoring sessions (n=56) using a classroom observation instrument designed to capture key features of instructional settings • Interviews with tutoring staff (n=64) about instructional formats, curriculum, adaptations for special student needs, staff professional background and training • Interviews with district and state administrators (n=19) involved in program implementation
Qualitative data collection (cont.) • Focus groups (n= 174) with parents of students who were eligible to receive SES and/or who had children receiving SES • Document analysis: formal curriculum materials from providers, diagnostic, formative, or final assessments used, policy documents on federal, state or district policies concerning the implementation of SES
Quantitative data collection • District demographic and administrative data and data from administration of standardized tests for elementary, middle and high school students eligible for SES • Student-level controls to account for selection into SES (registration and attendance) and outcome measures (changes in tests scores) • Data on providers and SES invoice data for constructing measures of SES “treatment” • 2007-08 through 2011-12 school years
Quantitative Sample Summary Number of Students Eligible, Registered and Attending SES by School Year and District 2007-08 School year SES-eligible Registered Attended SES Milwaukee 8284 3704 2194 Minneapolis 9217 1345 1124 Chicago 166386 46856 37095 Dallas 24031 6179 4632 Austin 6297 489 212 2008-09 School year SES-eligible Registered Attended SES Milwaukee 11992 4267 2689 Minneapolis 10618 2567 1412 Chicago 212504 69073 56921 Dallas 36770 8619 4911 Austin 7330 2761 1929 2009-10 School year SES-eligible Registered Attended SES Milwaukee 26798 6933 4998 Minneapolis 16484 4910 3533 Chicago 135418 65531 33465 Dallas 30916 10950 10637 Austin 4470 2986 1318
Statistical methods for impact estimation • Empirically model multiple stages of student selection into SES: registration among eligibles, attendance among registrants • Use information on student characteristics to match students participating in SES and attending 20 or more hours with those registered and receiving less than 20 hours of SES (and the same for cutpoints of 40 and 60 hours of SES) • Impacts measured as differences in changes in test scores between years and participant and comparison groups (standardized measures)
Distributions of SES hours attended • Hours of SES attended by students influenced (mechanically) by hourly rate charged by SES providers and SES dollars per-student allocated by districts (as well as student characteristics) • Chicago had highest hours attended—a function of higher per-student allocations and lower than average provider hourly rates • Elementary school students more likely to register for SES, attend SES, and attend more hours than middle and high school students
Other student characteristics related to SES registration and attendance • Whites, Hispanics, Asians significantly less likely to register for or attend SES; but if they attended, they were significantly more likely than African Americans to attend at least 40 or 60 hours • Students classified as English language learners had 50% higher odds of both registering for and attending SES • Students who attended SES in prior school year significantly more likely (130% higher odds) to register for SES and attend SES, and at elementary level, to attend at least 40 or 60 hours
Quantitative analysis findings • Statistically significant effects of SES on changes in students’ (standardized) math and reading scores for elementary students and middle school students (only math) who received 40+ hours of tutoring • Effect sizes: approx. 0.06 std. deviations for elementary students, or less than 1/6 of ave. annual gains in math and reading by 3rd-5th graders and 1/4 to 1/5 of mean effect size estimates from other educational interventions targeted at elementary school students • 1/4 of ave. annual gains in math by middle school students and 1/10 to 1/3 the size of effects of other educational interventions for middle school students
Quantitative analysis findings (cont.) • Estimated SES effect sizes for high school students in math and reading vary in size and are not statistically significant • Less than 10% of high school students in combined-site sample received 40 or more hours of SES in 2008-09 • Small numbers of students receiving 40 or more hours of SES in districts (other than Chicago) likely contributed to lack of statistical power for detecting statistically significant effects of SES (at this level of SES attendance)
Provider attributes and SES effects • Relationship of SES provider attributes—on-line delivery, district-operated, student-teacher ratio, hourly rate and ELL services—to SES effects: • Hours of SES attended: consistent, statistically significant (positive) predictor of students’ math and reading gains • On-line provision: negatively related to students’ math and reading gains • On-line providers charged significantly more per hour than other SES providers ($65 vs. $41) and invoiced districts for significantly fewer hours than other SES providers (18 vs. 35) • Students attending with district-operated SES providers received an average of 48 hours of SES compared to 29 hours on average for other providers
Qualitative-quantitative linking of research investigation and findings 19 Qualitative Quantitative Continuous feedback and integration
Investigating Practice: Qualitative Findings What happens during instructional time matters. We must ensure that students enrolled in SES… Improves student achievement attend a minimum amount of hours to reach a threshold that…
Guiding Principle: Instruction Matters For example… Instructional hours matter, but what is happening during these hours that explains: • effects or size of effects • low retention rates • differences in effects by content area • the “onion” of the variable (i.e. does advertised time = reported time = actual observed instructional time?)
Qualitative Data Collection: Sample Selection and Analysis by Format “Format” of tutoring sessions is a mixture of type and location. Our sub-formats for data collection and analysis are: • Online (n observations =6; N providers =59) • Offline (n observations =50; N providers =157)* • Home (n observations =14; N providers =13) • School (n observations =27; N providers =139) • Community (n observations =9; N providers =89) • Observed one-on-one (n=16) / not one-on-one (n=33) *93 out of 157 providers identify as more than one offline format
Core Questions – Year 1 Analysis • What happens during instructional time; what content areas and instructional activities are emphasized? • Given the intent of enhanced intensive academic support, what are the prevalent grouping patterns observed? • How many minutes of instructional time are students typically receiving? • How, if at all, are English language learners (ELL) and students with disabilities (SWD) being served? • What do district staff and providers view as core challenges to program improvement?
Core Findings • Reading and math are focal; homework doesn’t dominate; some test prep • Students getting tutoring in one on one or small group setting across the board • Evidence of attendance flux that gets in the way of intensity of instruction • Limited use of other activities known as key to quality; format matters in terms of conditions conducive to student engagement and achievement • Differentiated instruction for ELL and SWD rare
What is happening instructionally? • Focus on reading and mathematics. Reading and language arts—28 of 56 observations, Math—32 of 56 • Homework was done in very few of tutoring sessions observed (10 of 56 observations) • Skill Development and Test Preparation. In 15 out of 56 sessions observed, the explicit focus of the tutoring was test preparation activities.
What are grouping patterns? • Ratios of students to tutor relatively low. Home-based tutoring almost always involved a 1:1 grouping. Slightly over half of all observations excluding home-based tutoring involved 1:1. • Format matters 1:1 tutoring was much more likely to occur in online (5/6) and in-home (13/14) • More tutors needed. In 13 out of 33 observations with 2 or more students, not enough tutors to possibly have a 1:3 grouping pattern for all students.
How much instructional time? • Advertised sessions ranged from 60-150 minutes • Advertised time does not always equal instructional time. Irrespective of the format, students received less instructional time than what was advertised by providers • Magnitude of these differences varied by format. Offline sessions—especially in school- and community-based formats—had large discrepancies between advertised and instructional time
Instructional time: How much? Why the discrepancy? • Administrative tasks (e.g. rosters, snacks, transportation) • Issues inherent to format • In school (collect students, larger numbers, competing activities) • Community (transportation) • In-home (no roster, snack, or transportation)
Instructional Time: Attendance Flux Attendance Flux: • Measured by comparing the number of students observed in Observation Point A with the number of students observed in Observation Point B. • When these numbers were not the same, we counted this observation as having attendance flux
Instructional time: Attendance Flux • Of the 33 observations with 2 or more students, 18 had mobility • 6/18 sessions with mobility took place in community-based settings • 12/18 sessions with mobility took place in school-based settings • 0/18 sessions with mobility took place online or in home-based settings
Instructional time: What’s there? Common Tutoring Indicators Across Formats: • Frequently observed indicators (>.7)* • Use materials toward goal of instruction in M/RLA • Listen actively and attentively to students • Engage positively with students * Note: In this case only, .7 was used as a cut-off because there were so few common indicators at .8 or above across all formats
Instructional time: What’s not there? Uncommon Tutoring Indicators Across Formats: • Infrequently observed indicators (<.2) • Provide artistic/physical recreation activities • Provide community/family-linked activities • Read and write for HW • Math for HW • Students ask why, how, what if questions • Engage in peer-peer tutoring
Instructional time: Format Matters • Two good learning conditions were exceptionally high in home based and online: 1:1 ratio/grouping pattern and low mobility • In contrast, the same good learning conditions were less likely to be observed in school-based learning or community-based learning • In sum, format matters in terms of creating learning conditions conducive to student engagement and achievement
Differentiation for ELL • With very few exceptions, neither curriculum nor instruction was tailored to the unique needs of ELL students. • Occasional, but generally inadequate, instructional adjustments were observed • Tutors and providers did not have enough training or information for effective instruction
Differentiation for SWD • 13 out of 20 (not necessarily the same nine) providers advertised that they could serve students with disabilities, at least in a limited way or for limited special needs. • A major obstacle for providers, tutors, and researchers was identifying students with documented ELL or special education needs. The majority of tutors we observed and interviewed did not have access to IEPs or district data on ELL identification. • Therefore, both instructional methods as well as observations of these methods for such subgroups may have limited ability to project patterns
Challenges: Provider perspectives • Improving systems of communication between district and provider • Finding appropriate materials for diverse range of students(e.g. low reading levels, mobility) • Complex logistics (e.g., the steps necessary to start tutoring, eligibility issues, paperwork) • Challenges of building positive relationships with schools
Challenges: District perspectives • Budget constraints • Limited access to students IEPs, SWD classification or ELL classification. • Resource limitations in state approval and monitoring processes • Oversubscription and the prioritization process: Doing it “right” • Communication among various stakeholders
Challenges: Parent Perspectives • Communication • Parents would like improvement in the dissemination of information about services. • Clearer instructions and follow-up in the enrollment process • Improvement in communication amongst all stakeholders: district, schools, and providers • Improvement in the implementation of services: scheduling, behavior management, and tech support
Next steps • Continue qualitative fieldwork (observations, interviews and document analysis) in 2010-2011, 2011-2012, and 2012-2013 • Continue quantitative data collection in 2010-2011 and 2011-2012 • Continuous analysis of qualitative and quantitative data • Formal progress meetings with districts on an annual basis, informal conversations as needed
Contact information • Carolyn Heinrich - cheinrich@lafollette.wisc.edu • Patricia Burch – pburch@usc.edu sesiq2.wceruw.org