Download
1 / 61
640 likes | 923 Views
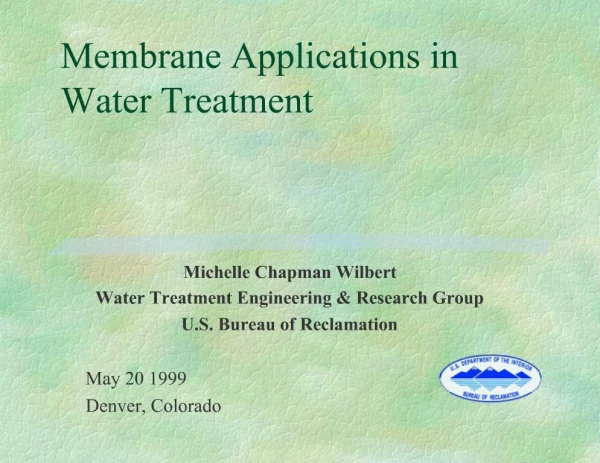
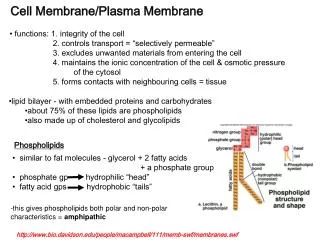
Membrane Applications. 2006 Surface Water Treatment Workshop Fargo, ND. YuJung Chang, Ph.D. HDR Engineering, Inc. Giardia. Polio Virus. Bacteria. Cryptosporidium. WQ Challenges. New Technologies in Demand. Increased Demand. Alternative Sources. Membrane Presentation Outline.

E N D
Membrane Applications 2006 Surface Water Treatment Workshop Fargo, ND YuJung Chang, Ph.D. HDR Engineering, Inc.
Giardia Polio Virus Bacteria Cryptosporidium WQ Challenges New Technologies in Demand Increased Demand Alternative Sources
Membrane Presentation Outline • Membrane Market Trend • Membrane Basics • Membrane Applications in US • Membrane Design & Operations • Summary
A Brief US Membrane History • Prior to 1990 mostly RO in industrial applications • Historically, smaller facilities (< 1 mgd) • 1st Significant MF/UF System in North America in 1993 (Saratoga, CA – 3.6 mgd) • Membrane Bioreactor emerged in early 1990’s • In-land brackish desalination in mid 1990’s • Over 250 Membrane WTP now on-line • Trend is to more, and larger facilities • Minneapolis – 70 and 95 mgd • Singapore – 72 mgd
Desalination Is Growing As Well Capacity (mgd) Number of Installations EDR SWRO BWNF SWRO EDR BWNF 44 92 110 15 20 250 71 110 BWRO BWRO
Other Perspectives • Membrane System Sales To Reach $9 Billion by 2008 (Mcllvaine Company, 2006) • $6.8 Billion in 2005 (33% Top End Growth) • Expected to Reach $10 Billion by 2010 • Includes Desalination and Low-Pressure Membranes • Microfiltration from $1.9 to $2.5 Billion • Only 2.5% of US Drinking Water is Treated with MF/UF Membranes
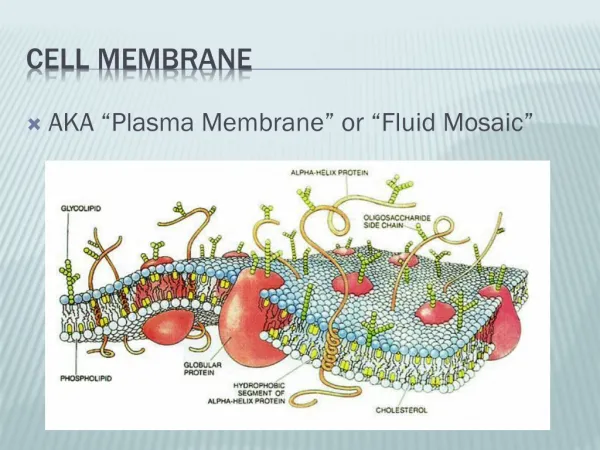
Membrane Classifications (Pore Size) Organic macromolecules Organic compounds Colloids Dissolved salts Viruses Bacteria Pollens Yeasts 0. 1 nm 0.01 mm 0. 1 nm 1 mm 0.1 mm 10 mm 100 mm RO Red globule hair Smallest microorganisms Polio virus visible to naked eye NF Nanofiltration UF Ultrafiltration MF Sand filter Microfiltration
Membranes Classification(Driving Force) • Vacuum (Submerged Membranes) • Compatible with higher solid concentration • Can be used for retrofit • High energy demand with air scouring • Noise & evaporation concerns
Membranes Classification(Driving Force) • Pressure (Canister Membranes) • More compact design • Cannot handle high solid concentration (> 100 NTU) for a substantial period of time
Membranes Classification(Configuration) • Flat Sheet (Spiral-wound) Mostly used in Reverse Osmosis & Nanofiltration
Membranes Classification(Configuration) • Tubular Membranes (OD > 3 mm) Mostly used in Industrial MF
Membranes Classification(Configuration) • Hollow Fiber Membranes (ID < 1.5 mm) Mostly used in MF & UF
Raw Water Filtered Water Membranes Classification(Location of Membrane ) • Inside-out Membranes • Outside-In Membranes
Membrane Applications • Filtration: Low-Pressure membranes (MF/UF) for turbidity & pathogen removal • Organic Removal: Nanofiltration (NF) for NOM removal • Inland Brackish Desalination: RO or NF • Seawater Desalination: RO or 2-stage NF • Membrane Bioreactor: MF/UF MBR
City of Lancaster, PA Susquehanna WTP (24 mgd) Chemical Addition PermeatePump Finished Water Pumping Supply Pump Particle Strainer Clearwell Membrane System To River High-Rate Solids Clarifier (DensaDeg) To Centrifuge Facility Construction to be completed in January 2009
City of Lancaster, PA Conestoga WTP (12 mgd) Chemical Addition PermeatePump Finished Water Pumping Clearwell Supply Pump Particle Strainer UV 1st Stage Membrane System To Sanitary Sewer 2nd Stage Membrane System Total construction cost (2 plants): $ 70 millions
City of Yuba City Fast-Track Filtration Upgrades • 16 to 24 mgd expansion • Design and construction completed in nine months • Contract incentives and penalties • Developed innovative approach that deferred construction of new filters and piping, resulting in a total savings of more than $2 million
Kamloops, BC, Canada • 42 mgd Zenon UF facility • Primary UF – Secondary UF – DAF – Centrifuge • Membranes operate with cyclical aeration: 10 seconds on, 10 seconds off
Yucaipa Valley Regional Water Filtration Facility • Pretreatment with MF (Pall), followed by NF for NOM Removal • Direct membrane filtration with no pretreatment (reservoir supply) • 12 mgd expandable to 36 mgd • Aesthetics extremely important
Water Replenishment District: RO • 2.5 mgd, 2-stage low pressure (150 psi) RO • GW TDS around 2000 mg/L • Constant flow rate, WQ • Since 2002, RO cleaned only once (2004)
Seward, NB: RO • 2 mgd GW RO since June 1, 2004 (Hydranautics) • Designed to reduce nitrate from 15.2 ppm to 2 ppm • Operators visit the plant once a day, monitor and controlled remotely from the wastewater plant
City of Goodyear, AZ • 2.5 mgd Ground water with high TDS (1,500 mg/L) & nitrate • RO (GE-Osmonics, 60-100 psi, 74% Recovery) • From concept to production in 6 months (DB) • Capital $1.42/1000 gal; O&M $0.93/1000 gal
Sarasota, FL: EDR • 12 mgd EDR facility, largest in the US (world) • 10 EDR units, with 30 racks for each unit • Reduce GW TDS from 1200 to 450 mg/L • Pretreatment for turbidity & HS
Swansea Water District, MA • Estuary under tidal influence • Salinity up to 32,000 mg/L • 1.5 mgd Desalination Membrane Plant • Pall/Dow Filmtec
Cauley Creek, GA: MBR • Constructed in 2 2.5-mgd phases (total 5 mgd) • Plant is optimized for meeting discharge limits of 0.13 mg/L total P and 0.5 mg/L ammonia • Staff indicated not much the plant can do to further reduce energy consumption without potentially violating system warranties or permit
Pooler, GA: MBR • 2.5 mgd MBR, operated 24 hours, staffed 8hr/day • The plant has discharge limits for ammonia, but not for phosphorus • Cut back on the aeration to only night times • Turned off UV to save energy
West Basin: MF, UV, RO • Largest Reuse facility in US • MF, RO, UV/H2O2 • 4 tailored reuse waters for different clients MF RO UV/H2O2
Membranes v.s. Sand • Membrane filtration mechanism • Sieving/Straining • Sand filtration mechanism • Interception, collision, electrostatic attraction • Straining only happens in cake filtration
Typical Membrane Filtration Cycle • Filtration (15 ~ 50 minutes) • Backwash (20 sec ~ 2 min) (No rinsing, surface wash, or filter-to-waste) Special Operation/Maintenance • Chemical Cleaning • Membrane Repair
TMP Membrane Performance More Fouling
Fouling is Part of Membranes • All membranes are subject to fouling, no exception • Fouling is acceptable as long as it is reversible and manageable (i.e., can be removed in a reasonable fashion)
Potential Fouling MaterialNatural Organic Matter • NOM with high SUVA • TOC > 4 mg/L would be a concern • Organic fouling is “sticky” and difficult to clean • Organic may serve as “cement” to bind other particulates and form a strong cake layer • Caustic cleaning (e.g. NaOH) and strong oxidant (e.g. H2O2) are effective for NOM fouling cleaning
Potential Fouling MaterialParticulate/Colloids • Inorganic particles alone would not cause much fouling • Inorganic particle cake layer could be easily removed by backwash • Excessive turbidity could clog membrane fiber lumens • Inorganic particles mixed with NOM could cause substantial fouling • Organic colloids could cause significant fouling and could be difficult to clean
Potential Fouling MaterialInorganic Material • Precipitation of Ca, Mn, Mg, Fe, and Al could cause significant fouling • Fine inorganic colloids (< 0.05 mm) could clog membrane pores and cause fouling • Prefer a negative Langelier Index • Acid, EDTA, SBS cleaning could be effective for inorganic fouling Langelier Index = Actual pH – Saturation pH Saturation pH = 2.18 - log[Ca+2] - log[HCO3-] L.I. > 0 : Oversaturated (tend to precipitate) L.I. < 0 : Undersaturated (tend to dissolve more)
Potential Fouling MaterialSynthetic Polymers • Polymers used for coagulant/filter aids & backwash water treatment • Presence of polymers in feed water could cause dramatic fouling, and sometimes irreversible • Free residual polymer is worse than particle-associated polymer • Cationic polymers are worst • Some polymers can be easily cleaned with chlorine and therefore are consider compatible with membranes
Fouling MitigationPretreatment • Reduce TOC level (< 4 mg/L) • Reduce Turbidity (< 5 NTU) • Reduce Hardness (< 150 mg/L) • Avoid substantial change in water chemistry, such as pH and other pretreatment chemicals • Prevent Oil and Polymers from entering the feed water
Fouling MitigationOperation • Use crossflow if turbidity is high (For Inside-out membranes) • Bleed a portion of the concentrate to avoid solid buildup • Operate at a lower flux (lower TMP) • Enhance pretreatment
Fouling MitigationCleaning Strategy • Frequent BW (shorter filtration cycle) • Longer BW duration • Higher BW pressure • Add cleaning chemicals in BW water • Frequent chemical cleaning