Download
1 / 47
500 likes | 1.44k Views
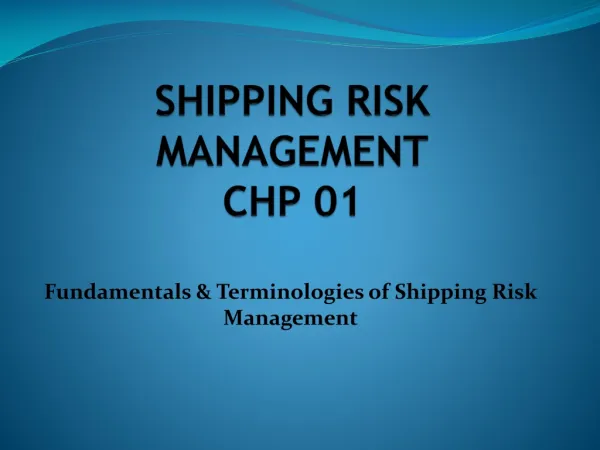
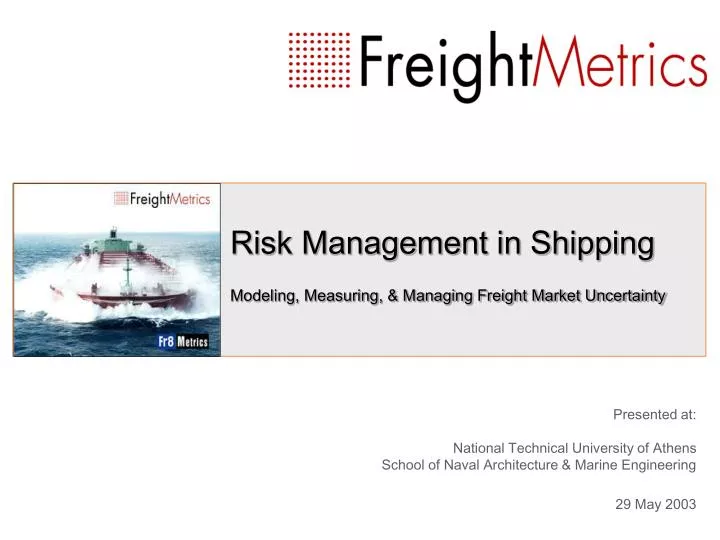
Risk Management in Shipping Modeling, Measuring, & Managing Freight Market Uncertainty Presented at: National Technical University of Athens School of Naval Architecture & Marine Engineering 29 May 200 3 Risk Management in Shipping Presentation Outline Introduction

E N D
Risk Management in ShippingModeling, Measuring, & Managing Freight Market Uncertainty Presented at: National Technical University of Athens School of Naval Architecture & Marine Engineering 29 May 2003
Risk Management in ShippingPresentation Outline • Introduction • About this presentation • About FreightMetrics • About Risk Management • Defining risk • The risk management process • Scope of risk management • Modern applications of risk management • Measuring Market Risk • The traditional approach to market risk measurement • The Value-at-Risk (VaR) approach
Risk Management in ShippingPresentation Outline • Measuring Market Risk in Shipping • Justification for risk management in shipping • Market risk measurement vs. market forecasting • Identifying the impact of freight market risk on fleet cash flow • Developing a framework for measuring freight market risk • Measuring Market Risk in Shipping Using the Fr8MetricsTM Methodology • Main methodological features • How does Fr8MetricsTM work? • Benefits of the Fr8MetricsTM methodology • Potential users and managerial applications • Software implementation • Managing Freight Market Risk • Altering the risk profile using managerial decisions • Altering the risk profile using freight derivatives
Risk Management in ShippingIntroduction About This Presentation • Our objective • Shipping is a business activity exposed to a wide variety of risks. • In this presentation we are concerned with the measurement of one particular form of risk – namely freight market risk, or the risk of loss arising from unexpected changes in freight rates. • Our motivation • Risk management is a notion that exists in financial markets for decades, having experienced significant technological and modeling advances over the years. • Shipping has proved rather slow in adopting modern risk management techniques and best practices from other industries. • Our motivation is to present a modern framework for measuring freight market risk, using the paradigm of other market-sensitive industries.
Risk Management in ShippingIntroduction About FreightMetrics • What FreightMetrics is… • A provider of consulting services and software solutions for measuring and managing freight market risk. • Working closely with Shipping Banks, Shipowners, and Freight Traders, in order to quantify their exposure to freight market risk in terms of cash-flow sensitivity. • Our approach lies in transferring best practices and modern methodologies from the area of financial risk management to shipping. • What FreightMetrics is NOT… • Shipbroker. • Forecasting agency. • Market news vendor. • Financial intermediary. For more information about FreightMetrics, visit our website at www.freightmetrics.com
Risk Management in ShippingAbout Risk Management Defining Risk • Definition of Risk • We define (financial) risk as the prospect of financial loss due to unforeseen changes in underlying “risk factors”. These risk factors are the key drivers affecting portfolio value and financial results. Such risk factors are equity prices, interest rates, exchange rates, commodity prices, freight rates, etc. • Types of Risks • Business: The risk of loss due to unforeseen changes in demand, technology, competition, etc., affecting the fundamentals of a business activity. • Market: The risk of loss arising from unexpected changes in market prices or market rates. • Credit: The risk of loss arising from the failure of a counterparty to make a promised payment. • Operational: The risk of loss arising from the failures of internal systems or the people who operate in them. • Other types: Legal, Liquidity, etc.
Risk Management in ShippingAbout Risk Management The Risk Management Process • The Risk Management process • There is a wide misconception amongst practitioners, especially within the shipping industry, who consider risk management as synonymous to hedging. This is an oversimplification and does not reflect the true dimension of risk management. • In fact, risk management is a process that involves three separate steps: • Risk Modeling: Before any attempt to take decisions on risk considerations, we must identify the underlying risk factors, understand their behavior, and try to model their dynamics. This is the basic foundation on which the other phases of the risk management cycle are built. • Risk Measurement: After identifying and modeling the underlying risk factors, we must determine their significance and quantify their influence on portfolio value and financial results. • Risk Management : Having identified and measured our risks, we are then able to take informed decisions on whether to reduce our exposure or alter our risk profile based on our risk preferences – hedging is one such alternative course of action.
Risk Management in ShippingAbout Risk Management Scope of Risk Management • Risk Management ≠ Hedging • As already mentioned, risk management is not synonymous to hedging. Hedging is just one alternative for the active management of risk. • Moreover, risk management does not necessarily imply risk reduction. In fact, the objective of risk management is NOT to reduce risk, but – more importantly – to quantify and control risk. • Most of the times, the objective is not to eliminate risk, but rather to alter our risk profile according to the prevailing market conditions, our risk preferences, and potential regulatory or contractual requirements. • Risks are embedded in any business activity. For a shipowner, the decision to invest in a vessel signifies his belief that freight rates will go up, earning him a return on his investment that is higher than the “risk-free” interest rate. However, there is no “free lunch” in the economy; his decision to invest creates at the same time a natural exposure to freight rates, accepting the risk that freight rates may in fact go down. Risks are simply unavoidable in any profit-taking activity.
Risk Management in ShippingAbout Risk Management Scope of Risk Management • Uncertainty vs. Variability 1 “Variability is a phenomenon in the physical world to be measured, analysed and where appropriate explained. By contrast, uncertainty is an aspect of knowledge.” Sir David Cox • Risk management is only useful for the mere fact that we cannot predict the future. There are two components of our inability to be able to precisely predict what the future holds: these are variability and uncertainty. • Variability is the effect of chance and is a function of the system. It is not reducible through either study or further measurement, but may be reduced through changing the physical system. • Uncertainty is the assessor’s lack of knowledge (level of ignorance) about the parameters that characterize the physical system that is being modeled. It is sometimes reducible through further study, or through consulting more experts. • Risk management can do very little to reduce variability (markets will continue to fluctuate no matter how advanced risk management gets), but can be very effective in reducing uncertainty for those involved in risk-taking decisions. 1 Adapted from the book Risk Analysis by David Vose, Chapter 2: “Quantitative Risk Analysis, Uncertainty and Variability”
Risk Management in ShippingAbout Risk Management Modern Applications of Risk Management • Modern applications of Risk Management • Exposure measurement and reporting • Market risk (since early 90s) • Credit risk (since late 90s) • Operational risk (new area) • Economic capital estimation • Allocation of capital • Risk-based pricing • Risk limits • Risk-adjusted performance evaluation
Risk Management in ShippingAbout Risk Management Modern Applications of Risk Management • Example: Risk-Adjusted Performance Evaluation • Consider two traders who are evaluated on the basis of their realized profits at some future date. Trader B ended up with higher profits compared to Trader A. Does this mean he is more skilled than Trader A? Does he deserve a higher bonus? What about the risk incurred by each trader through their trading strategy?
Risk Management in ShippingMeasuring Market Risk The Traditional Approach to Risk Measurement • The Mean-Variance framework • Under the Mean-Variance framework, we model financial risk in terms of the mean and variance (or standard deviation, the square root of variance) of the Profit/Loss (P&L) or the returns of our portfolio. • The Mean-Variance framework often makes the assumption that returns obey a normal distribution (strictly speaking, the mean-variance framework does not require normality, but it is easier to understand its statistics). • Portfolio Theory • The origin of portfolio theory can be traced back to the work of Markowitz (1952) which earned him the Nobel prize. • Portfolio theory starts with the premise that investors choose between portfolios on the basis of maximizing expected return for any given portfolio standard deviation or minimizing standard deviation for any given expected return. • One of the key insights of portfolio theory is that the risk of any individual asset is measured by the extent to which that asset contributes to overall portfolio risk which depends on the correlation of its return with the returns to the other assets in the portfolio (a result known as diversification effect). • Portfolio theory typically makes the assumption of normally distributed returns.
Risk Management in ShippingMeasuring Market Risk The Value-at-Risk (VaR) Approach • The origin and development of VaR • In the late 70s and 80s, a number of major financial institutions started working on internal models to measure and aggregate risks across the institution as a whole. • The best known of these models is the RiskMetrics model developed by JP Morgan. According to industry legend, this model is said to have originated when the chairman of JP Morgan, Dennis Weatherstone, asked his staff to give him a daily one-page report – the famous “4:15 report” – indicating risk and potential losses over the next 24 hours, across the bank’s entire trading portfolio. • The report was ready by around 1990 and the measure used was Value-at-Risk (VaR), or the maximum likely loss over the next trading day. VaR was estimated from a system based on standard portfolio theory, using estimates of the standard deviations and correlations between the returns of different traded instruments. • In early 1994, JP Morgan set up the RiskMetrics unit to make its data and basic methodology available to outside parties. This bold move attracted a lot of attention and raised awareness of VaR techniques and risk management systems. • The subsequent adoption of VaR systems was very rapid, first among securities houses and investment banks, and then among commercial banks, other financial institutions and non-financial corporates. • Today, VaR is widely used in almost every market-sensitive industry (with the exception perhaps of shipping!) and has even gained recognition from regulatory authorities.
Risk Management in ShippingMeasuring Market Risk The Value-at-Risk (VaR) Approach • VaR in practice • VaR Basics: • VaR on a portfolio is the maximum loss we might expect over a given holding or horizon period, at a given level of confidence (probability). • VaR is less restrictive on the choice of the distribution of returns and the focus is on the tail of that distribution – the worst p percent of outcomes.
Risk Management in ShippingMeasuring Market Risk The Value-at-Risk (VaR) Approach • VaR in practice • Estimating VaR: The various methodologies for estimating VaR actually differ on their particular technique for constructing the distribution of possible portfolio values from which VaR is inferred. The most common methodologies are: • Analytical methods (Variance/Covariance) • Historical simulation • Monte-Carlo simulation • Attractions of VaR: • VaR is a single, summary, statistical measure of possible portfolio losses, providing a common and consistent measure of risk across different positions and risk factors. • It takes account of the correlations between different risk factors. • It is fairly straightforward to understand, even for non-technical people. • VaR variants: Following the same logic, other “at risk” measures have been proposed to quantify risk in various settings: Cash Flow at Risk (CaR), Earnings at Risk (EaR), etc.
Risk Management in ShippingMeasuring Market Risk in ShippingJustification for Risk Management in Shipping • Business and market risk in shipping: the two faces of the same coin • Most industries can distinguish between business risks and market risks. These industries have to worry about business risks and try to hedge away market risks which may have an adverse side-effect on financial results. For example, an auto manufacturer has to worry about business risks such as technology, competition, production, R&D, but may also have an exposure to FX risk, which may hamper exports, or interest rate exposure which may increase debt service on floating rate obligations. • Other industries cannot distinguish between business risks and market risks. The most pronounced example is maybe that of financial institutions. A significant part of the business of financial institutions is to take direct exposure in the world’s equity, interest rate, currency, and commoditymarkets. • Shipping can be said to belong to the industries that cannot distinguish between business risks and market risks. Financial results in shipping are directly affected by movements in the world’s freight rate markets. Shipowners are in effect in the business of managing shipping risk affecting a portfolio of physical assets, rather than simply managing a fleet of vessels.
Risk Management in ShippingMeasuring Market Risk in ShippingJustification for Risk Management in Shipping • High market volatility • Freight rates have historically been very volatile. The impact of unforeseen geo-political events and the slow speed of adjusting supply to demand have often resulted in dramatic fluctuations in the level of freight rates.
Risk Management in ShippingMeasuring Market Risk in ShippingJustification for Risk Management in Shipping • Industry inefficiencies • Capital needs vs. sources of funds: • Shipping is a capital intensive industry with significant funding needs for fleet expansion and replacement purposes. Yet, it has very limited opportunities to diversify its sources of funding, as most of its financing comes in the form of bank debt. • Asset – Liability (mis)matching • Asset economic life >> term of debt financing • Variable (uncertain) revenues to meet fixed debt claims • Pro-cyclical lending practices • Many banks tend to be influenced by the general sentiment of the market and ignore the cyclical nature of the business. Thus, they appear more willing to lend when the market (and vessel prices) is high, despite the fact that the market will eventually revert back to lower levels. In contrast, they appear rather hesitant to extend credit at a period of low freight rates, although they are likely to rise to more sustainable levels.
Risk Management in ShippingMeasuring Market Risk in ShippingJustification for Risk Management in Shipping • Lessons from the High Yield disaster of the late 90s • In the late 90s, many shipping companies decided to tap the public debt markets with high-yield bonds. Historically, it was the first massive attempt of the industry to diversify away from bank debt, using an alternative source of external funding. • Unfortunately, nearly all of these high yield issues subsequently defaulted, mainly due to insufficient cash flow generation. • This indicated poor risk assessment and a lack of appropriate tools to evaluate shipping market risks. • Example: Source: Moody’s (2002)
Risk Management in ShippingMeasuring Market Risk in ShippingJustification for Risk Management in Shipping • Lessons from the High Yield disaster of the late 90s • Examples: Source: Moody’s (2002)
Risk Management in ShippingMeasuring Market Risk in ShippingMarket Risk Measurement vs. Market Forecasting • Types of maritime forecasting • Structural econometric models: Model freight rates as a dependent variable, driven by a number of independent variables, usually representing macro-economic factors that influence shipping demand, e.g. GDP growth, oil prices, industrial output, etc. • Time series models: Model freight rates using the structure (serial correlation) in the past history of the data itself. Future freight rates are determined based on lagged values of their own history and do not exploit or infer causality with other economic variables. • Difficulties in maritime forecasting • Demand for shipping is characterized as derived demand, meaning that it depends on the demand of the commodities that are shipped by sea. • Econometric models are prone to specification problems. Model fit can always improve by including more explanatory variables, which may introduce multicollinearity problems. • It is possible that a small error in demand estimation may lead to a gross mis-estimation of freight rates (compare D1→D2 vs. D2→D3).
Risk Management in ShippingMeasuring Market Risk in ShippingMarket Risk Measurement vs. Market Forecasting • Differences in scope • Scope: Prepare for future vs. Predict the future • Motivation: Prevent unexpected losses vs. Make a profit (beat the market) • Horizon: Long-term vs. Short-term • Emphasis: Tail of the distribution vs. Mean of the distribution • Differences in methodology • Measurement does not presuppose causality relations between economic variables. • Forecasting models have potentially infinite specifications (depending on choice of explanatory variables). • Measurement focuses on producing the complete picture of potential outcomes (entire distribution) rather than producing a point estimate (the mean of the distribution). So, do we discard forecasting? NO, it can serve a useful complementary role, especially in revealing causality relations between economic variables. Forecasting may also assist in certain chartering or trading decisions in the short-run, where it is most effective.
Risk Management in ShippingMeasuring Market Risk in ShippingImpact of Freight Rate Volatility on Cash Flow • Identifying the impact of freight rate volatility on fleet cash flow • Fluctuations in freight rates directly affect fleet cash flow. • Cash flow performance is the topmost concern in shipping. • Ship financing belongs to the family of “Project Financing” (other forms of project financing include airlines, infrastructure, real estate, etc.). There is a principle in project financing: repayment MUST come from the operating cash flows of the financed asset. • So, what really matters in measuring freight market risk is the impact of freight rate variability on cash flow performance. • Case study • We performed a simple exercise (historical simulation) of the cash flow generation of a handysize dry bulker over two separate time periods (period A: Jan-1980 to Dec-1986, and period B: Jan-1987 to Dec-1993). • We used the same set of assumptions in both cases (see the following slide), except for using the actual freight rates for each period and the actual second-hand value of the financed vessel at the start of the each period. • This exercise not only illustrates the impact of freight rate volatility on cash flow, but also emphasizes the impact of shipping cycles and the importance of proper timing in maritime decision-making.
Risk Management in ShippingMeasuring Market Risk in ShippingImpact of Freight Rate Volatility on Cash Flow • Case study: impact of freight rate volatility on fleet cash flow • Historical simulation assumptions and actual freight rate data (source: Clarksons)
Risk Management in ShippingMeasuring Market Risk in ShippingImpact of Freight Rate Volatility on Cash Flow • Case study: impact of freight rate volatility on fleet cash flow • Chart of monthly net cash flow (after debt service, but excluding balloon payment):
Risk Management in ShippingMeasuring Market Risk in ShippingImpact of Freight Rate Volatility on Cash Flow • Case study: impact of freight rate volatility on fleet cash flow • Chart of accumulated liquidity (excluding balloon payment):
Risk Management in ShippingMeasuring Market Risk in ShippingA Framework for Measuring Freight Market Risk • Basic Assumptions and Objectives • It is possible to develop a framework for measuring freight market risk using the VaR paradigm. • The risk factors in this framework consist of freight rates. • Freight rates are assumed to follow a random walk and are modeled using appropriate stochastic processes. • The stochastic processes that describe the evolution of freight rates are able to replicate certain known characteristics of freight rate dynamics (cyclicality, seasonality, random shocks). • Monte-Carlo simulation is used to generate future freight rate scenarios, in accordance with the underlying stochastic process for each risk factor. • The key measure of risk is fleet cash flow. • For each freight rate scenario, we re-compute future cash flow, using an appropriate cash flow model which takes into account debt repayment and other cost items (e.g. drydocking costs, special surveys, etc.). • Thus we construct the entire distribution of future cash flow, from which we can make VaR-type inferences based on a specified confidence level.
Risk Management in ShippingMeasuring Market Risk in ShippingA Framework for Measuring Freight Market Risk • Modeling the stochastic behavior of freight rates • Any time series data can be thought of as being generated by a particular stochastic or random process, the “true” data-generating process (DGP). A concrete set of data, such as a historical data-series on a freight rate, can be regarded as a particular realization (i.e. a sample) of the underlying true DGP. The distinction between the stochastic process and its realization is akin to the distinction between population and sample in cross-sectional data. Just as we use sample data to draw inferences about a population, in time series we use the realization to draw inferences about the underlying stochastic process.
Risk Management in ShippingMeasuring Market Risk in ShippingA Framework for Measuring Freight Market Risk • Selecting a stochastic process • The modeling of any price variable begins with the choice of a particular stochastic process which captures the characteristics of asset price dynamics. In order to make this selection, we are guided by theoretical considerations, such as the theory concerning the operation of freight equilibrating mechanisms, as well as by empirical analysis of historical data (e.g. mean reversion, fat tails, autocorrelation, volatility clustering, etc.) • There is a large number of alternative stochastic processes that can be tested to capture the dynamics of freight rates. Below we provide a few indicative (simplistic) models: • Geometric Brownian Motion (GBM): • Ornstein-Uhlenbeck (O-U) process: • Jump-Diffusion (O-U with Jumps):
Risk Management in ShippingMeasuring Market Risk in ShippingA Framework for Measuring Freight Market Risk • Estimating model parameters • As discussed previously, a concrete set of historical data can be regarded as a particular realization (i.e. a sample) of the underlying “true” DGP. The objective is to find a theoretical DGP that provides the best fit for the actual data. This is accomplished by estimating the parameters of each theoretical DGP and comparing the various models in terms of some measure of goodness-of-fit. • Many stochastic processes admit exact discretization or numerical approximations (using the Euler or higher-order methods) which allow the testing of the underlying processes using standard econometric techniques. Both the GBM and O-U processes admit such discretizations which lead to time-series specifications of a linear autoregressive form. • For example, the GBM model can be estimated by running the following regression: • The parameters of an O-U process can be estimated using discrete-time data by running the regression: and then calculating • More advanced models require other techniques, e.g. Maximum Likelihood Estimation
Risk Management in ShippingMeasuring Market Risk in ShippingA Framework for Measuring Freight Market Risk • Simulating the stochastic evolution of freight rates • Having discretized the stochastic process and estimated its parameters, we proceed with iterative sampling from the probability distribution(s) used in our model, in order to generate future freight rate scenarios. • This technique is known as Monte-Carlo simulation and includes several steps: • Random number generation (pseudo-random or low-discrepancy numbers) • Transformation of independent random number into correlated random numbers • Variance reduction methods (to improve the accuracy for a given number of runs) • Example: As discussed in the previous slide, the O-U process can be interpreted as the continuous-time version of a first-order autoregressive process in discrete time. Specifically, the O-U process is the limiting case as Δt 0 of the following AR(1) process: where ε(t) is normally distributed with mean zero and standard deviation σε • Thus, we can simulate an O-U process, by drawing random numbers from a normal distribution with mean zero and standard deviation σε and generating r(t) as follows:
Risk Management in ShippingMeasuring Market Risk in ShippingA Framework for Measuring Freight Market Risk • Building the distribution of future fleet cash flows • For each freight rate scenario produced by our simulation, we re-compute the fleet cash flow based on some cash flow model and plot the results in a histogram. This represents the distribution of future fleet cash flows. • Making risk inferences from the distribution of future fleet cash flows • The distribution of cash flow results reveals the risk profile of the fleet, in terms of the range of possible cash flows that the fleet is able to generate in the future. • We can “read” this distribution in order to make probabilistic inferences about the risk of our fleet. For example: • What is the probability that the fleet will breakeven? • What is the maximum possible cash deficit at the 95% probability level?
Risk Management in ShippingMeasuring Market Risk in ShippingA Framework for Measuring Freight Market Risk • A practical example • Assuming a simple O-U process, we modeled the 1-year Time-Charter rate for dry bulk handysize vessels and simulated 1000 different scenarios. Below we compare the distribution of actual monthly returns (282 observations –from Feb-76 to Jul-99) with the distribution of simulated (random) monthly returns. From this we can compute the cash flow of the vessel and produce the distribution of possible cash flows for next month.
Risk Management in ShippingMeasuring Market Risk with Fr8MetricsTMMain Methodological Features • Main methodological features • Fr8Metrics™ is a framework for quantifying freight market risk in shipping portfolios. Fr8Metrics™ is generally based on the Value-at-Risk (VaR) concept, but differs in the use of proprietary stochastic models developed to simulate the evolution of freight rates. These models are designed to replicate the unique seasonal and cyclical characteristics of shipping markets. • The Fr8Metrics™ methodology is simulation-based rather than forecast-based. It draws on advanced Monte-Carlo simulation techniques to generate future freight market scenarios from which we estimate the likely distribution of various financial measures, such as cash flow, accumulated liquidity, hull cover, NPV, etc. • Fr8Metrics™ is able to incorporate the influence of correlations, not only across different market segments within the shipping industry, but also between shipping and financial markets. Thus, it is possible to capture potential diversification effects within a portfolio that combines both shipping and financial assets. • Fr8Metrics™ is able to support portfolios that combine both physical assets (vessels) and “paper” assets (derivatives).
Risk Management in ShippingMeasuring Market Risk with Fr8MetricsTMHow Does Fr8MetricsTM Work? • Step 1: Portfolio Definition • Input details for the fleet (charter agreements, cost data, etc.), loans (repayment schedules, interest cost, collateral vessels, etc.), and derivatives. • Step 2: Risk Mapping • Assign risk factors to vessels and derivatives. • Step 3: Project Definition • Select the portfolio(s) which will be simulated. • Specify cash flow model. • Specify risk metric. • Specify simulation parameters (number of scenarios, horizon, confidence level, etc.)
Risk Management in ShippingMeasuring Market Risk with Fr8MetricsTMHow Does Fr8MetricsTM Work? • Step 4: Scenario Generation • Generate n (=number of scenarios specified in Step 3) future realizations for each risk factor for the time horizon specified in Step 3, in accordance with the underlying stochastic process of each risk factor:
Risk Management in ShippingMeasuring Market Risk with Fr8MetricsTMHow Does Fr8MetricsTM Work? • Step 5: Metric Computation • Iteratively substitute values from each of the n scenarios from Step 4 into the cash flow model specified in Step 3, calculate the n future cash flow results, and plot them in a histogram:
Risk Management in ShippingMeasuring Market Risk with Fr8MetricsTMHow Does Fr8MetricsTM Work? • Step 6: Risk Inference • Using the distribution of cash flow results from Step 5, find the cash flow estimate corresponding to the desired confidence level specified in Step 3. • Having exposed the complete risk profile of the portfolio(s) specified in Step 3, the user (banker, shipowner, etc.) is able to take calculated, risk-informed decisions in accordance with his riskpreferences:
Risk Management in ShippingMeasuring Market Risk with Fr8MetricsTMBenefits of the Fr8MetricsTM Methodology • General benefits of Monte-Carlo based methods • Flexibility to support a wide range of stochastic processes. • Not restrictive in terms of distributional assumptions. • Ability to incorporate correlations among risk factors. • Ability to incorporate decision rules along the simulated paths (e.g. exercise of charter options). • Particular benefits of the Fr8MetricsTM methodology • Utilizes stochastic models specifically developed to capture freight rate dynamics. • Reveals diversification effects across shipping assets, as well as between shipping and financial exposures. • Provides a framework for monitoring derivatives, developing hedging strategies and assessing hedge effectiveness.
Risk Management in ShippingMeasuring Market Risk with Fr8MetricsTMPotential Users and Managerial Applications • Shipping Banks • Determining credit terms: maximum advance ratio, liquidity covenant, loan spread • Risk assessment: repayment risk, probability of covenant breach • Estimating default probabilities, verifying internal risk ratings • Promoting cross-selling, derivatives sales, hedge proposals • Shipowners • Investment decisions, e.g. dry bulk vs. tanker segments • Chartering decisions, e.g. time charter vs. spot employment • Financing decisions, e.g. high-yield bond vs. bank debt • Hedging decisions, e.g. derivatives vs. long-term charter • Freight Traders • Risk assessment and monitoring • Risk-adjusted performance evaluation
Risk Management in ShippingMeasuring Market Risk with Fr8MetricsTMSoftware Implementation • Product features • Hierarchical portfolios • Multi-currency environment • Periodic updates of parameter estimates for underlying stochastic models • 3 cash flow model formats (Fleet, GAAP, Sources and Uses) • User-defined cash flow items • Generation of pro-forma cash flow statements • Technology • Windows-based • Developed in .NET environment • Extensive use of XML • Databases: SQL / Access
Risk Management in ShippingManaging Freight Market RiskAltering the Risk Profile with Managerial Decisions • Risk-informed decision-making • As mentioned previously, the objective of risk management is not necessarily to eliminate risk, but rather to alter our risk profile according to the prevailing market conditions, our risk preferences, and potential regulatory or contractual requirements. • Having exposed the complete risk profile of a shipping portfolio within a VaR framework, we are able to decide whether it suits our riskpreferences or to make comparisons among alternative business strategies. Choice of strategy is subject to risk preference (Strategy B: higher expected return, but higher risk) Strategy A is dominant (Strategy A: higher expected return AND lower risk)
Risk Management in ShippingManaging Freight Market RiskAltering the Risk Profile with Managerial Decisions • Asset Allocation decisions • Expand the fleet in the dry cargo or the tanker segment? • Buy one VLCC or two Aframaxes? • Buy one 5-year old vessel or two 15-year old vessels? • Order a newbuilding in Korea (cheaper, but FX risk) or in the US? • Chartering decisions • Trade in the spot market or lock in a 3-year time charter at a rate that is –currently- lower than the spot rate? • Accept a high time charter rate or a lower time charter rate with an option to renew? • Charter-in or charter-out for the next one year? • Funding decisions • Finance new acquisitions through bank debt or high yield issue? • Go for a 5-year loan with low spread or a 7-year loan with higher spread?
Risk Management in ShippingManaging Freight Market RiskAltering the Risk Profile with Freight Derivatives • Definition of derivatives • In chemistry, a derivative is a “substance related structurally to another substance and theoretically derivable from it (...) a substance that can be made from another substance”.1 Derivatives in finance work on the same principle. They are financial instruments whose promised payoffs are derived from the value of something else, generally called the underlying. 1 This definition comes from the online version of the Merriam-Webster Collegiate Dictionary. See http://www.britannica.com/cgi-bin/dict?va=derivative • Types of freight derivatives • Forward Freight Agreements (FFAs): An agreement between two counterparties to settle a freight rate for a specified quantity of cargo or type of vessel, for a certain route, and at a certain date in the future. • The underlying asset of the FFA contracts can be any of the routes that constitute the indices produced by the Baltic Exchange. • FFAs are settled in cash on the difference between the contract price and an appropriate settlement price at expiration. • To establish an FFA, we need to specify: route, price, duration/quantity, settlement • Other types of derivatives: Options, Swaps, Swaptions, etc.
Risk Management in ShippingManaging Freight Market RiskAltering the Risk Profile with Freight Derivatives • The market of freight derivatives • Historical development of freight derivatives: • Freight derivatives existed since 1985 with the creation of the BFI (Baltic Freight Index), a basket of individual dry cargo routes. This index served as a settlement mechanism for freight futures listed on BIFFEX (subsequently merged with LIFFE, contracts de-listed in April 2002). • Since 1992, the individual shipping routes could be traded “over the counter” (i.e. not through an exchange) in the form of FFAs. • Current market size and players: • Estimated annual turnover: $4.0 billion in notional value of freight. • Types of players: Shipowners, Charterers, Trading Houses, Shipbrokers • The role of the Baltic Exchange: • Sets the rules and oversees the process of collecting and processing the brokers’ assessments of freight rates in more than 30 cargo routes. These prices are used for the settlement of FFA transactions.
Risk Management in ShippingManaging Freight Market RiskAltering the Risk Profile with Freight Derivatives • Fundamentals of freight derivatives trading • Trading process • Price discovery through brokers • FFA negotiation • Counterparty clearance • Documentation • Basis risk (sources: correlation, time lag) • Marking-to-Market • Designing a hedging program • Understand the distribution / dynamics of freight rates. • Estimate the impact of adverse freight rate movements on fleet cash flow. • Decide whether to hedge, depending on external and internal considerations. • Choose the appropriate financial instruments. • Determine how much to hedge.
Risk Management in ShippingReferences, Links, and Further Reading • References • Adland, Roar (June 2000), Theoretical Vessel Valuation and Asset Play in Bulk Shipping, Thesis submitted for the MS in Ocean Systems Management, MIT • Attikouris, Kyriakos (April 2000), Modeling Freight Rates, Thesis submitted for the Diploma in Mathematical Finance, University of Oxford • Attikouris, Kyriakos (March 1996), Time Series Applications in the Ocean Shipping Business, Project submitted for the course Applied Time Series Analysis (MBA program), University of Rochester • Concalves, Franklin de Oliveira (September 1992), Optimal Chartering and Investment Policies for Bulk Shipping, Thesis submitted for the PhD in Ocean Systems Management, MIT • Dowd, Kevin (2002), Measuring Market Risk, Wiley • Drewry Shipping Consultants (1997), Shipping Futures and Derivatives, Briefing Report • Moody’s Investor Services (2002), Default & Recovery Rates of European Corporate Bond Issuers, 1985-2001 • Stopford, Martin (1997), Maritime Economics, Routledge • Vose, David (2000), Risk Analysis, Wiley • Wilmott, Paul (1998), Derivatives, Wiley • Magazines: Risk, Marine Money, Lloyd’s Shipping Economist • Seminar notes: Freight Derivatives seminar, organized by the Cambridge Academy of Transport and the Baltic Exchange (25 November 2002) • Links • www.riskmetrics.com RiskMetrics Group • www.gloriamundi.org GloriaMundi (the best internet source on VaR material) • www.balticexchange.com The Baltic Exchange