Download
1 / 38
380 likes | 572 Views
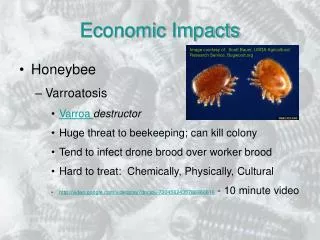
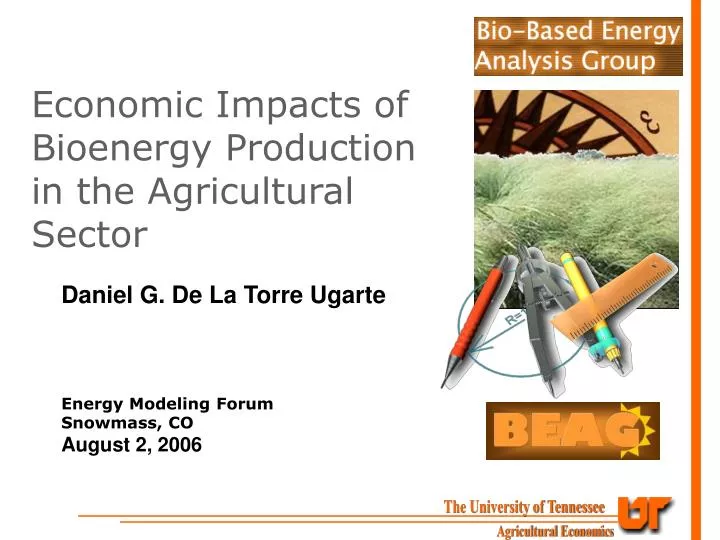
Economic Impacts of Bioenergy Production in the Agricultural Sector. Daniel G. De La Torre Ugarte. Energy Modeling Forum Snowmass, CO August 2, 2006. Objectives. Asses the impacts on agricultural sector and economics of the nation of agriculture as a major source of energy

E N D
Economic Impacts of Bioenergy Production in the Agricultural Sector Daniel G. De La Torre Ugarte Energy Modeling Forum Snowmass, CO August 2, 2006
Objectives • Asses the impacts on agricultural sector and economics of the nation of agriculture as a major source of energy • Replace 25% of btu content of projected gasoline consumption with ethanol. • As with a pie, in this study, there are any number of slices one can take. The information presented here is but one slice.
Functions & Interactions Crop Supply Livestock Expected Returns & Production (305 Regions) (U.S.) Available Acreage Price Acreage Allocation Based on Expected Returns Available For Domestic Consumption Acreage, Production, Expenditures Value of Exports & Production Export Use Food Use Govt Payments Cash Receipts Domestic Use Total Use Production Expenses Price Crop Demand Ag Income Gross & Net Realized Income (U.S.) (U.S.)
POLYSYS Add-In Modules • Stochastic: Introduce random shocks • Regional Yields • Export Shocks • Environmental: Replaces Crop Supply Module’s 305 Regional LPs • Allows up to 40 Rotational Activities • Allows Irrigated and Dryland • Four Dominant Soils
72 Billion US. Gasoline Consumption and Ethanol Demand at 25% Energy Content
Bio - products and National Energy Policy Bioenergy Demand Feedstock Price Regional Feedstock Supply Agricultural Policy Curves Regional Bioenergy Transportation and and Bio - product Conversion Cost Supply Curves Expansion Curve for Bioenergy and Bio - product Industry Methodology (2)
Feedstock Price and Allocation New Biomass Price Biomass & Crop Supply Feedstock Price Equivalent Cellulosic vs Corn Competition If Other Demands not filled, Fill with Corn Grain Crop Demand New Corn Price Determined Figure Corresponding Biomass Price Compare Prices If difference, adjust price. If no difference, quit.
The Story • Agriculture can have a significant role in meeting America’s energy needs. • Providing bio-energy feedstocks could be a new $25 billion industry measured in net returns. • Savings in government payments of $16 to $100 billion. • Could reduce imports of gasoline by 1.5 billion barrels or by more than $ 230 billion dollars
Assumptions for a Potential Outlook • Yields by 2025: • Major crops continue w/ trend line: corn (195 bu/ac), soybeans (51 bu/ac), wheat (53 bu/ac) • Energy crops (6 to12 dt/acre) • Management practices by 2025: • Corn: no-till (20% to 50%); reduced till (20% to 30%) • Wheat: no-till (12% to 50%; reduced till (20% to 30% • Land: • Total acres in cropland, forestland, pastureland are unchanged • CRP:15 of the 34.7 million acres are available for energy crop production
Assumptions for a Potential Outlook • Commodity Programs: • Remain as specified in 2006 • Conversion Efficiency: • Improved cellulosic ethanol to 89 gallons/ton by 2025 and corn ethanol conversion to 3 gallons/bushel by 2015 • Other Energy • Further, we are in the analysis producing 1.7 billion gallons of biodiesel along with 250 to 500 billion kwh of electricity, but we have chosen to focus the presentation on ethanol
Feedstock for Energy* Nearly 1 Billion Tons * Does not include forest harvest
CRP in 2025 (million acres) Land Use: 2006, 2015, and 2025 (million acres) Other Hay Energy Crop Wheat Soybeans Corn By 2025 14% of cropland is in energy dedicated crops
Distribution of the Production of Cellulosic Materials, 2010 Tons
Distribution of the Production of Cellulosic Materials, 2015 Tons
Distribution of the Production of Cellulosic Materials, 2020 Tons
Distribution of the Production of Cellulosic Materials, 2025 Tons
Net Economic Impacts to National Economy, 2025 • The full economic impact extends beyond agriculture. • Incorporating changes in income, land shifts, and conversion of the biomass to energy we estimated the national impacts.
Conclusions Preliminary results indicate that: • There is sufficient potential from America’s agricultural and forest lands to produce energy without impacting food security • Currently, we have substantial capacity for production from underutilized lands
Conclusions (Continued) • Marketing additional energy from agriculture sector could result in: • Increased Farm Income • Reduced Government Payments • Increased Rural Economic Development • Enhanced Environmental Benefits • Reduction in Foreign Oil Dependency
Net carboneq flux to the atmosphere as a function of agricultural practice
Supply curve estimates from POLYSYS for 2005 and 2014 with and without pastureland available
Project analysis team includes Chad Hellwinckel, Kim Jensen, Jamey Menard, Roland Roberts, Marie Walsh, and Brad Wilson in addition to Burton English and Daniel G. de la Torre Ugarte Bio-based Energy Analysis Group http://beag.ag.utk.edu/ Agricultural Policy Analysis Center http://agpolicy.org/ Department of Agricultural Economics, Institute of Agriculture University of Tennessee http://www.agriculture.utk.edu/