Download
1 / 18
180 likes | 355 Views
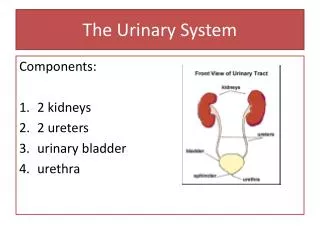
Biomagnification: you are what you eat but don’t excrete. Jon Akin Terry Davin Win Everham Evelyn Gaiser Amanda McConney: Facilitator Courtney Richmond. Course description. Introductory ecology course Small to large courses Part of a larger unit on cycling matter

E N D
Biomagnification: you are what you eat but don’t excrete Jon Akin Terry Davin Win Everham Evelyn Gaiser Amanda McConney: Facilitator Courtney Richmond
Course description • Introductory ecology course • Small to large courses • Part of a larger unit on cycling matter • Prerequisite knowledge • Graph structure, types of graphs • Appropriate graph for a given data set • Trophic structure & energy flow
Teaching challenges • Understanding the scientific process • Critical thinking skills • Ability to interpret graphs • Critical consumers of scientific information
Student learning objectives By the end of this unit, the student will be able to: • Interpret graphs and draw conclusions from them • Describe the process of biomagnification • Analyze graphs to identify factors that influence the process of biomagnification • Apply the law of conservation of matter to biomagnification
Sequence of events Day 0• Pre-test Day 1• Review Pre-test • Introducing complexity with a graph • Jigsaw • Stage 1: Expert Groups • Stage 2: Mixed Groups Day 2• Case studies: graph analysis* • Report back to class • Wrap up Later• Post-test
PRE-TEST • Learning objectives addressed: • interpret graphs & draw conclusions • describe biomagnification http://www.ainc-inac.gc.ca/ncp/pub/pdf/bio/ch3-4_e.pdf
Day 1 • Guided review based on results of pre-test • think-pair-share to introduce complexity with a graph
Day 1 • Jigsaw stage 1: experts review factors that influence biomagnification • Organismal factors • Community factors • Landscape factors • Jigsaw stage 2: mixed groups - experts peer teach
Day 2 • Jigsaw stage 3: mixed groups analyze case studies • Case study 1 • Case study 2 • Case study 3
Student Directions • Refresh your expertise on the factors that influence biomagnification • (organismal ,community, landscape) • Discuss your case study with your group • Come to a consensus on the case study questions • Be prepared to report to the class • (assign spokesperson)
Case study 1 Click for graphs
Case study 2 Cadmium concentration (mg/g wet weight) in muscle, liver and kidney of different age groups of habour porpoise from Greenland (Source: Johansen, P., 1997, Paludan-Müller et al. 1993 ).
Day 2: wrap-up • Common trends among case studies • Overview of factors that affect biomagnification • There is no away (persistence in the environment)
Assessments • Pre-test (formative) • Post-test (summative) • Think-pair-share (formative, not graded) • Graded exam question(s)
Feedback • Please make any editorial comments on the material & return to the team • Did we ask the right questions on the pre-test? • Did the handouts have enough information for the tasks? • Should the pre-test and post-tests be identical? • Timing of post-test administration