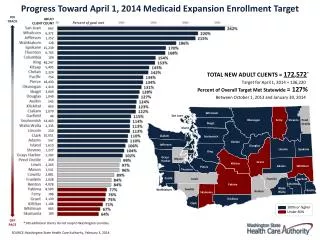
Download
1 / 87
870 likes | 1.01k Views
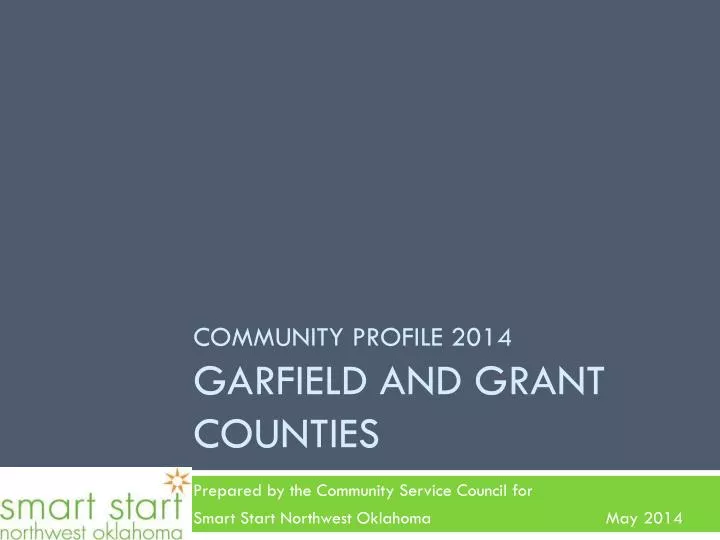
Community profile 2014 Garfield and grant counties. Prepared by the Community Service Council for Smart Start Northwest Oklahoma May 2014. Garfield and Grant Counties. Demographic trends Family, children and youth Economic indicators Health status.

E N D
Community profile 2014Garfield and grant counties Prepared by the Community Service Council for Smart Start Northwest Oklahoma May 2014
Garfield and Grant Counties • Demographic trends • Family, children and youth • Economic indicators • Health status
Demographic trends Total population Age Race and Hispanic Origin
Population Trends and Projections for Total Population and under 5: Garfield County, 1980 to 2050 projections Source: Oklahoma Department of Commerce, “2012 Demographic State of the State Report: Oklahoma State and County Population Projections through 2075.”
Population Trends and Projections for Total Population and under 5: Grant County, 1980 to 2050 projections Source: Oklahoma Department of Commerce, “2012 Demographic State of the State Report: Oklahoma State and County Population Projections through 2075.”
Population Trends and Projections by Age Group: Oklahoma, 1970-2030 projections Source: US Census Bureau, 1970, 1980, 1990, 2000, and 2010 Censuses; Oklahoma Department of Commerce, 2012 Demographic State of the State Report: Oklahoma State and County Population Projections through 2075.
Population Distribution by Age Group: Garfield and Grant Counties, 2012 Estimates Source: US Census Bureau, Population Estimates Program, “Annual Estimates of the Resident Population for Selected Age Groups by Sex: April 1, 2010 to July 1, 2012,” June 2013.
Race Comparison for Total Population and Young Children: Garfield County, 2012 Estimates Total population = 61,189 Under 5 population = 4,470 Source: Census Bureau, Population Estimates Program, “Annual Estimates of the Resident Population by Sex, Age, Race and Hispanic Origin for Counties, April 1, 2010 to July 1, 2012,” June 2013.
Race Comparison for Total Population and Young Children: Grant County, 2012 Estimates Total population = 4,516 Under 5 population = 259 Source: Census Bureau, Population Estimates Program, “Annual Estimates of the Resident Population by Sex, Age, Race and Hispanic Origin for Counties, April 1, 2010 to July 1, 2012,” June 2013.
Family, children and youth Family dynamics Children and youth
Family Type by Race: Garfield County, 2008-12 All NH White Black American Indian Asian Other Race 2+ Races Hispanic Note: These distributions refer to families with young children. Source: US Census Bureau, 2008-12 American Community Survey. (American Community Survey data are estimates based on a sample of the population. These estimates are midpoint values within a 90% confidence range, which can be very large, especially for smaller geographies.)
Family Type by Race: Grant County, 2008-12 All NH White Notes: These distributions refer to families with young children. Families of races other than non-Hispanic White are too few in Grant County to accurately describe by family type. Source: US Census Bureau, 2008-12 American Community Survey. (American Community Survey data are estimates based on a sample of the population. These estimates are midpoint values within a 90% confidence range, which can be very large, especially for smaller geographies.)
Children in Non-Traditional Settings: Garfield and Grant Counties, 2010 living with: group quarters: Source: US Census Bureau, 2010 Census.
Summary of Risk Factors for Infants: Garfield County, 2012 Total births = 949 Note: Lighter colored bars represent 2008 data. Source: Oklahoma State Department of Health, Vital Statistics 2008 and 2012, OK2SHARE, accessed on 2/20/14.
Summary of Risk Factors for Infants: Grant County, 2012 Total births = 52 Note: Lighter colored bars represent 2008 data. Source: Oklahoma State Department of Health, Vital Statistics 2008 and 2012, OK2SHARE, accessed on 2/20/14.
Characteristics of Births to Teens (age 15-19): Garfield County, 2012 Total teen births = 118 Age-specific fertility rate = 65.7 /1,000 females age 15-19 Note: Lighter colored bars represent 2008 data. Source: Oklahoma State Department of Health, Vital Statistics 2008 and 2012, OK2SHARE, accessed on 2/24/14.
Births by Trimester of Entry into Prenatal Care: Garfield County, 1980 to 2012 Source: Oklahoma State Department of Health (OK2SHARE).
Births by Trimester of Entry into Prenatal Care: Grant County, 1980 to 2012 Source: Oklahoma State Department of Health (OK2SHARE).
Births by Marital Status of Mother: Garfield County, 1980 to 2012 Source: Oklahoma State Department of Health (OK2SHARE).
Births by Marital Status of Mother: Grant County, 1980 to 2012 Source: Oklahoma State Department of Health (OK2SHARE).
Infant Mortality Rates (5-year averages): Garfield and Grant Counties, State of Oklahoma, 1980 to 2012 Healthy People 2020 goal: 6.0 Source: Oklahoma State Department of Health (OK2SHARE).
The Adverse Childhood Experiences (ACE) Study Pyramid Death Conception Mechanisms by which Adverse Childhood Experiences Influence Health and Well-being throughout the Lifespan Source: The Adverse Childhood Experiences Study website: www.acestudy.org, “About the Adverse Childhood Experiences Study.”
Adverse Childhood Experiences… …growing up in a household with ADVERSE CHILDHOOD EXPERIENCES: • Recurrent physical abuse • Recurrent emotional abuse • Sexual abuse • An alcohol or drug abuser • An incarcerated household member • Someone who is chronically depressed, suicidal, institutionalized or mentally ill • Mother being treated violently • Living with one or neither parent • Emotional or physical neglect • Smoking • Overeating • Physical inactivity • Heavy alcohol use • Drug use • Promiscuity …DISEASE, DISABILITY AND SOCIAL PROBLEMS IN ADULTHOOD …ADOPTION OF HEALTH RISK BEHAVIORS… Nicotine addiction Alcoholism Drug addiction Obesity Depression Suicide Injuries Unintentional pregnancy Adolescent pregnancy Heart disease Cancer Chronic lung and liver disease Stroke Diabetes Fetal death Sexually transmitted diseases Source: The Adverse Childhood Experiences Study website: www.acestudy.org, “What are Adverse Childhood Experieinces (ACE’s).”
Adverse Childhood Experiences: Oklahoma Source: Oklahoma Institute for Child Advocacy, “Oklahoma KIDS COUNT Factbook, 2006-2007;” Annie E. Casey Foundation,“KIDS COUNT Data Book, 2013.”
Oklahoma Rankings on Specific Child Indicators Source: Annie E. Casey Foundation, “KIDS COUNT Data Book, 2013.”
Oklahoma Rankings on Indicators of Child Well-being Source: Annie E. Casey Foundation, “KIDS COUNT Data Book, 2013.”
Adverse Childhood Experiences County Rankings Rankings: 1 = best, 77 = worst *Indicates a tie with at least one other county. Source: Oklahoma KIDS COUNT Factbook, 2006-2007, Oklahoma Institute for Child Advocacy
DHS Licensed Child Care Services Provided to Children Under Age 5, by Age: Garfield County, October 2001 & 2012 Source: Oklahoma Department of Human Services, Monthly Statistical Bulletin.
DHS Licensed Child Care Services Provided to Children Under Age 5, by Age: Grant County, October 2001 & 2012 Source: Oklahoma Department of Human Services, Monthly Statistical Bulletin.
DHS Child Care Licensed Facilities and Capacity, by Type: Garfield County, October 2012 Facilities Capacity Source: Oklahoma Department of Human Services, Monthly Statistical Bulletin.
DHS Child Care Licensed Facilities and Capacity, by Type: Grant County, October 2012 Facilities Capacity Source: Oklahoma Department of Human Services, Monthly Statistical Bulletin.
3 Year Old Early Childhood Enrollment: Garfield County School Districts, October 2003 and 2012 October 2003 October 2012 Source: Oklahoma State Department of Education.
3 Year Old Early Childhood Enrollment: Grant County School Districts, October 2003 and 2012 October 2003 October 2012 Source: Oklahoma State Department of Education.
4 Year Old Early Childhood (pre-k) Enrollment: Garfield County School Districts, October 2003 and 2012 October 2003 October 2012 Source: Oklahoma State Department of Education.
4 Year Old Early Childhood (pre-k) Enrollment: Grant County School Districts, October 2003 and 2012 October 2003 October 2012 Source: Oklahoma State Department of Education.
Average Daily Membership and Percentage of Students Enrolled in Special Education: Garfield County by School District, School Year 2011-12 Average Daily Membership Percent in Special Education Garfield County total ADM = 10,272 Percent in special education = 13.3% Source: Oklahoma Office of Educational Quality and Accountability, “Profiles 2012 District Reports.”
Average Daily Membership and Percentage of Students Enrolled in Special Education: Grant County by School District, School Year 2011-12 Average Daily Membership Percent in Special Education Grant County total ADM = 779 Percent in special education = 15.5% Source: Oklahoma Office of Educational Quality and Accountability, “Profiles 2012 District Reports.”
Educational Indicators, High School Class of 2012: Garfield County School Districts Source: Oklahoma Office of Accountability, “Profiles 2012 State Report.”
Educational Indicators, High School Class of 2012: Grant County School Districts Source: Oklahoma Office of Accountability, “Profiles 2012 State Report.”
Child Abuse and Neglect: State of Oklahoma, Garfield and Grant Counties, FY2012 Notes: An “alleged victim” represents a report of child abuse and/or neglect accepted by OKDHS for investigation or assessment, and may include multiple children. Each “confirmed victim” of child abuse and/or neglect indicates one child. Since a child may be confirmed abused and/or neglected multiple times in a year, “confirmed victims” is not an unduplicated count of children. Source: Oklahoma Department of Human Services, Child Abuse and Neglect Statistics.
Juvenile Arrests by Type of Crime: Garfield County, 2001-12 A total of 291 juvenile arrests were made in Garfield County in 2012, for a rate of 47.2 per 1,000 juveniles age 10-17, down from 667 arrests and a rate of 104.9 in 2001 Murder, Rape, Robbery, Aggravated Assault, Burglary, Larceny, and Motor Vehicle Theft All drug arrests reported as Sale/Manufacturing and Possession Driving Under the Influence, Liquor Law Violations, and Drunkenness Other Assaults, Disorderly Conduct, Curfew & Loitering, Runaway, and all other non-traffic offenses Source: Oklahoma State Bureau of Investigation, Uniform Crime Reports.
Juvenile Arrests by Type of Crime: Grant County, 2001-12 A total of 3 juvenile arrests were made in Grant County in 2012, for a rate of 6.3 per 1,000 juveniles age 10-17, little change from 4 arrests and a rate of 6.2 in 2001 Murder, Rape, Robbery, Aggravated Assault, Burglary, Larceny, and Motor Vehicle Theft All drug arrests reported as Sale/Manufacturing and Possession Driving Under the Influence, Liquor Law Violations, and Drunkenness Other Assaults, Disorderly Conduct, Curfew & Loitering, Runaway, and all other non-traffic offenses Source: Oklahoma State Bureau of Investigation, Uniform Crime Reports.
Economic indicators Labor force participation Living wage and poverty Role of education Income inequality Program participation
Unemployment Rates: Oklahoma, Garfield County and Grant County, 1990 to 2013 Nov’13 Source: Bureau of Labor Statistics.