Download
1 / 14
160 likes | 490 Views
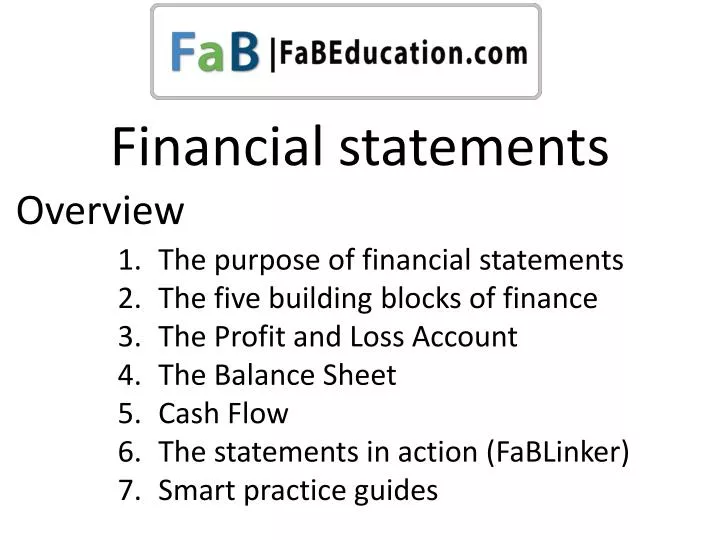
Financial statements. Overview. The purpose of financial statements The five building blocks of finance The Profit and Loss Account The Balance Sheet Cash Flow The statements in action (FaBLinker) Smart practice guides . Financial Statements are…. The “scorecards” of business showing.

E N D
Financial statements Overview The purpose of financial statements The five building blocks of finance The Profit and Loss Account The Balance Sheet Cash Flow The statements in action (FaBLinker) Smart practice guides
Financial Statements are… The “scorecards” of business showing ❶ Whether the business made a profit or a loss ❷The overall financial position of the business
They are built on 5 blocks REAL_E Revenue Profit & Loss Account Expenses Revenue – Expenses = Profit Assets Balance Sheet Liabilities Equity Assets – Liabilities = Equity
A Profit and Loss Account looks like this Revenue Direct Expenses (Costs) Indirect Expenses to manage, operate and administer the business } Items arising from financing and fixed assets
And a Balance Sheet like this } Assets Long (>12 months) } Short(<12 months) } Short(<12 months) Liabilities } Long (>12 months) Equity } Owners’ Funds
Cash flow A cash flow model for an inventory based business buying and selling on credit ❶Receive goods to Inventory ❸Sell goods (60 days?) ❹Receive payment for goods (45 days after sale?) Non-operating inflows e.g. Capital, Loans, grants and asset sales Cash ❷Pay supplier (45 days?) Overheads payments (Daily, weekly , monthly) Non-operating outflows e.g. taxation, capital expenditure and repayments of loan principal . www.fabeducation.com
Why Profit is not the same as Cash www.fabeducation.com
Narration Is this only playing with figures? NO! This is what smart managers do. They use the financial model to design the best possible Business Model And then Make it happen! Planning in business is not a “Mystic Meg” prediction about the future It is about shaping it. Fix cash by: Debtor days to 60 Buy only 950 units Fix profit by: Increasing Selling price to €110
Exercise 1 “Transactions Exercise” This is a directed practice in using FaBLinker to understand how finance and business interact. This exercise explores and explains how five transactions - representative of our business DNA building blocks REAL_E – are reflected in the P & L, Balance Sheet and cash flow The exercise is designed to provide the foundation to move on to further directed smart-practice routines. You will use use FaBLinker as a “sandbox” for self-directed, unrestricted practice to embed the SENSE of cause and effect relationships between the business and financial models. This sense is an invaluable attribute for managers seeking to make informed business decisions.
An introduction to FaBLinker Practice 1 Open FaBLinker on www.fabeducation.com Build this simple business model and watch the Interaction between the business model and the statements. Practice by changing the figures until you are confident that you can see the link between the business model and the statements. Selling price = €10 Purchase price = €5 Buy for cash = 150 units Sell for cash = 100 units Why did nothing happen to the statements until you entered the opening stock? Answer: The prices are nominal until a business transaction takes place. Save this starting data as Practice 1 as we will build on it in practice 2. www.fabeducation.com
Exploring overheads Practice 2 the file from Practice 1. Add overheads and save it as Practice 2. Practice by changing the figures until you are confident that you can see the interplay between the Business Model and the P & L. * Remember to enter 365 in the “Debtor days” and “Creditor days” cells in the business model column to instruct the application that you want credit transactions to remain outstanding in full Selling price = €10 Purchase price = €5 Buy for cash = 130 units Buy on Credit = 20 units* Sell for cash = 80 units Sell on credit = 20 units* Fixed overheads = €100 Overheads paid = 100% www.fabeducation.com
Exploring capital and Fixed Assets Practice 3 Practice 2 and add new Share Capital, a new loan and buy an asset. Save the file as Practice 3, as we will use it again later. Practice by varying the figures until you are confident that you can see the interplay between the business model and the Balance Sheet. Selling price = €10 Purchase price = €5 Buy on credit = 20 units Buy for cash = 130 units Sell on credit = 20 Sell for cash = 80 units Fixed overheads = €100 Overheads paid = 100% Introduce new share capital = €500 Draw down a new loan = €300 Acquire new assets = €200 www.fabeducation.com
Exploring the difference between cash & profit Practice 4 ` Why do the figures show these results? Write down the answers before reading them on page 34 of the workbook and explore on FaBLinker any ones you find difficult. www.fabeducation.com
Where did those figures come from? Practice 5 Focus on the business transactions one at a time e.g. enter an overhead in FaBLinker and see the impact on the financial statements. Clear, predict and test Repeat for every type of transaction www.fabeducation.com