Download
1 / 1
20 likes | 344 Views
A ruggedness analysis of sonication in the Single Tube Method (ASTM E2871-12) Blaine Fritz, Al Parker, Diane Walker. ID: #621 July / 2014. S ponsored by: CBE IA. Ultrasonic cleaning and sonication. Methods (cont’d). Introduction. Discussion. Formation and Collapse of Cavitation Bubbles.

E N D
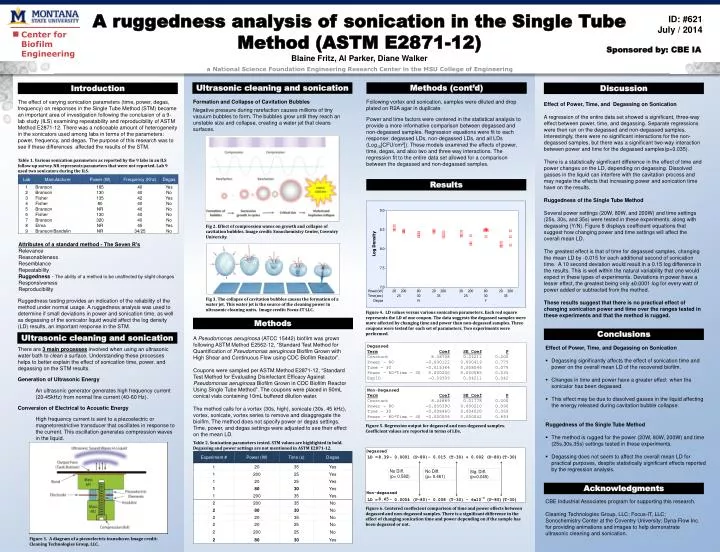
A ruggedness analysis of sonication in the Single Tube Method (ASTM E2871-12) Blaine Fritz, Al Parker, Diane Walker ID: #621 July / 2014 Sponsored by: CBE IA Ultrasonic cleaning and sonication Methods (cont’d) Introduction Discussion Formation and Collapse of Cavitation Bubbles Following vortex and sonication, samples were diluted and drop plated on R2A agar in duplicate. Power and time factors were centered in the statistical analysis to provide a more informative comparison between degassed and non-degassed samples. Regression equations were fit to each response: degassed LDs, non-degassed LDs, and all LDs (Log10[CFU/cm2]). These models examined the effects of power, time, degas, and also two and three way interactions. The regression fit to the entire data set allowed for a comparison between the degassed and non-degassed samples. Effect of Power, Time, and Degassing on Sonication A regression of the entire data set showed a significant, three-way effect between power, time, and degassing. Separate regressions were then run on the degassed and non-degassed samples. Interestingly, there were no significant interactions for the non-degassed samples, but there was a significant two-way interaction between power and time for the degassed samples(p=0.035). There is a statistically significant difference in the effect of time and power changes on the LD, depending on degassing. Dissolved gasses in the liquid can interfere with the cavitation process and may negate the effects that increasing power and sonication time have on the results. Ruggedness of the Single Tube Method Several power settings (20W, 80W, and 200W) and time settings (25s, 30s, and 35s) were tested in these experiments, along with degassing (Y/N). Figure 6 displays coefficient equations that suggest how changing power and time settings will affect the overall mean LD. The greatest effect is that of time for degassed samples, changing the mean LD by -0.015 for each additional second of sonication time. A 10 second deviation would result in a 0.15 log difference in the results. This is well within the natural variability that one would expect in these types of experiments. Deviations in power have a lesser effect, the greatest being only ±0.0001 log for every watt of power added or subtracted from the method. These results suggest that there is no practical effect of changing sonication power and time over the ranges tested in these experiments and that the method is rugged. The effect of varying sonication parameters (time, power, degas, frequency) on responses in the Single Tube Method (STM) became an important area of investigation following the conclusion of a 9-lab study (ILS) examining repeatability and reproducibility of ASTM Method E2871-12. There was a noticeable amount of heterogeneity in the sonicatorsused among labs in terms of the parameters: power, frequency, and degas. The purpose of this research was to see if these differences affected the results of the STM. Negative pressure during rarefaction causes millions of tiny vacuum bubbles to form. The bubbles grow until they reach an unstable size and collapse, creating a water jet that cleans surfaces. Table 1. Various sonication parameters as reported by the 9 labs in an ILSfollow-up survey. NR represents parameters that were not reported. Lab 9 used two sonicators during the ILS. Results Fig 2. Effect of compression waves on growth and collapse of cavitation bubbles. Image credit: Sonochemistry Center, Coventry University. Attributes of a standard method - The Seven R’s Relevance Reasonableness Resemblance Repeatability Ruggedness- The ability of a method to be unaffected by slight changes Responsiveness Reproducibility Fig 3. The collapse of cavitation bubbles causes the formation of a water jet. This water jet is the source of the cleaning power in ultrasonic cleaning units. Image credit: Focus-IT LLC. Ruggedness testing provides an indication of the reliability of the method under normal usage. A ruggedness analysis was used to determine if small deviations in power and sonication time, as well as degassing of the sonicator liquid would affect the log density (LD) results, an important response in the STM. Figure 4. LD values versus various sonication parameters. Each red square represents the LD of one coupon. The data suggests the degassed samples were more affected by changing time and power than non-degassed samples. Three coupons were tested for each set of parameters. Two experiments were performed. Methods Conclusions Ultrasonic cleaning and sonication A Pseudomonas aeruginosa (ATCC 15442) biofilm was grown following ASTM Method E2562-12, “Standard Test Method for Quantification of Pseudomonas aeruginosaBiofilm Grown with High Shear and Continuous Flow using CDC Biofilm Reactor”. Coupons were sampled per ASTM Method E2871-12, “Standard Test Method for Evaluating Disinfectant Efficacy Against Pseudomonas aeruginosaBiofilm Grown in CDC Biofilm Reactor Using Single Tube Method”. The coupons were placed in 50mL conical vials containing 10mL buffered dilution water. The method calls for a vortex (30s, high), sonicate (30s, 45 kHz), vortex, sonicate, vortex series to remove and disaggregate the bioiflm. The method does not specify power or degas settings. Time, power, and degas settings were adjusted to see their effect on the mean LD. Degassed TermCoefSE CoefP Constant 8.38708 0.04211 0.000 Power - 80 -0.000122 0.000419 0.775 Time - 30 -0.015364 0.008046 0.079 Power - 80*Time - 30 0.000200 0.000085 0.035 ExpID-0.09509 0.04211 0.042 • Effect of Power, Time, and Degassing on Sonication • Degassing significantly affects the effect of sonication time and power on the overall mean LD of the recovered biofilm. • Changes in time and power have a greater effect when the sonicator has been degassed. • This effect may be due to dissolved gasses in the liquid affecting the energy released during cavitation bubble collapse. • Ruggedness of the Single Tube Method • The method is rugged for the power (20W, 80W, 200W) and time (25s,30s,35s) settings tested in these experiments. • Degassing does not seem to affect the overall mean LD for practical purposes, despite statistically significant effects reported by the regression analysis. There are 3 main processes involved when using an ultrasonic water bath to clean a surface. Understanding these processes helps to better explainthe effect of sonication time, power, and degassing on the STM results. Generation of Ultrasonic Energy An ultrasonic generator generates high frequency current (20-45kHz) from normal line current (40-60 Hz). Conversion of Electrical to Acoustic Energy High frequency current is sent to a piezoelectric or magnetorestrictive transducer that oscillates in response to the current. This oscillation generates compression waves in the liquid. Non-Degassed TermCoefSE CoefP Constant 8.44889 0.01778 0.000 Power - 80 -0.000390 0.000210 0.090 Time - 30 -0.008460 0.004020 0.059 Power - 80*Time - 30 -0.000006 0.000042 0.893 Figure 5. Regression output for degassed and non-degassed samples. Coefficient values are reported in terms of LDs. Table 2. Sonication parameters tested. STM values are highlighted in bold. Degassing and power settings are not mentioned in ASTM E2871-12. Acknowledgments CBE Industrial Associates program for supporting this research. Cleaning Technologies Group, LLC; Focus-IT, LLC; Sonochemistry Center at the Coventry University; Dyna-Flow Inc. for providing animations and images to help demonstrate ultrasonic cleaning and sonication. Figure 6. Centered coeffecient comparison of time and power effects between degassed and non-degassed samples. There is a significant difference in the effect of changing sonication time and power depending on if the sample has been degassed or not. Figure 1. A diagram of a piezoelectric transducer. Image credit: Cleaning Technologies Group, LLC.