Download
1 / 27
290 likes | 499 Views
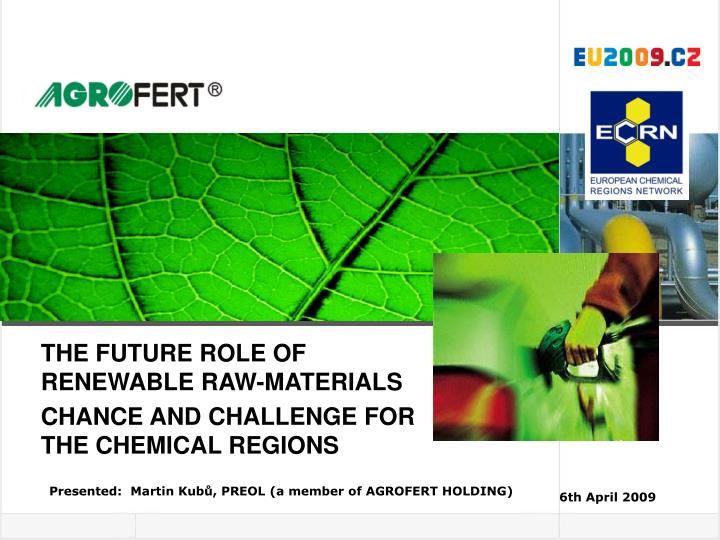
THE FUTURE ROLE OF RENEWABLE RAW-MATERIALS C HANCE AND CHALLENGE FOR THE CHEMICAL REGIONS. Presented : Martin Kubů, PREOL (a member of AGROFERT HOLDING ). 6th April 2009. INTRODUCTION. AGROFERT HOLDING, a.s.

E N D
THE FUTURE ROLE OF RENEWABLE RAW-MATERIALS CHANCE AND CHALLENGE FOR THE CHEMICAL REGIONS Presented: Martin Kubů, PREOL (a member of AGROFERT HOLDING) 6th April 2009
INTRODUCTION AGROFERT HOLDING, a.s. Leading company in CZ/SK agriculture with substantial stakes in chemistry and food industry with consolidated turnover more than 100 bln CZK in 2008. Martin Kubů Worked in KAUČUK, a.s., ČESKÁ RAFINÉRSKÁ, a.s. , PARAMO,a.s. and ALIACHEM, a.s.. Recently responsible for group renewable business, motor fuel trading and biofuels. Chairman of the Board of PREOL, a.s., a competence centre of AGROFERT and AGROPOL for biofuels, motor fuels and renewable energy.
GROUP SYNERGY CHEMISTRY/RENEWABLES Regional leader in industrial (non energetic) NG consumption (as „feedstock“ ) AND Important regional electricity buyer AND at the same time utility producer at chemical plants AND due to participation in regional agriculture important player in biomass sourcing/consumption = HIGH POTENCIAL FOR SYNERGIES BETWEEN RENEWABLES, REGIONAL RELATIONSHIP AND CHEMICAL PRODUCTION
OUR BUSINESS FINDINGS BIOMASS usage as renewable energy/chemical feedstock in CZ is influenced: DIRECTLY by: (i) CZ local conditions for substitutes (WIND, CNG, SOLAR, etc.) and (ii) subvention allocations (frequently non consistently applied – SOLAR/WIND availability,Excise tax for BIOFUELS/CNG, Green bonuses , etc.) INDIRECTLY by: (i) differences in BIOMASS SUPPORT SCHEMES in neighbor areas Decision to run business in renewable segment is FREQUENTLY INFLUENCED BY OTHER FACTORS than relating to BIOMASS PRODUCTION CYCLE
FEEDSTOCK POTENCIAL FOR 1G BIOFUELS PRODUCTION IN CZ Including feedstock for 2G biofuels (biomass, FGW, etc. ) in CZ exists higher potencial than EU recommended target 8% of motor fuel born on renewable used for transport in 2020.
MOTOR FUEL EXCISE TAX in EU AND IN CZ/GERMANY Fossile fues Excise tax worth 0,0856 €/l…… …… Energy tax on biofuel in Germany worth 0,09 €/l…….and will grow 12
RENEWABLE VS. FOSSILE Till 2020 supports for „ fossil fuels“ might be 104 bln CZK Till 2020 supports for renewable Biofuels might be 18,2 bln only = 14,5% of theoretical support for other fossil fuels
SOLID BIOMASS: Decision to run business in renewable segment is FREQUENTLY INFLUENCED BY OTHER FACTORS than relating to BIOMASS PRODUCTION CYCLE/MARKET PRICE
PREFFERED CONDITIONS FOR FOSSIL ENERGY SOURCES (FES) COMPARING BIOMASS (I) INCREASE SUPPORT NEEDED FOR BIOMASS, (II) REDUCE FES ATTRACTIVNESS AS FEEDSTOCK FOR REGIONAL CHEMICAL INDUSTRY DUE TO STEADILY GROWING PRICES IT INCREASES COMPETITION FOR REGIONAL CHEMICAL INDUSTRY DUE TO (I) LOWER UTILISATION OF LOCAL SOURCES, (II) INCREASE PRODUCT FLOW INTO EU MARKET
PREFFERED CONDITIONS FOR FOSSIL ENERGY SOURCES (FES) COMPARING BIOMASS (I) INCREASE SUPPORT NEEDED FOR BIOMASS, (II) REDUCE FES ATTRACTIVNESS AS FEEDSTOCK FOR CHEMICAL INDUSTRY DUE TO STEADILY GROWING PRICES Germany: $7.60 Russia: $1.50 UK: $8.65 Canada: $7.10 Belarus: $3.15 Belgium: $8.50 Ukraine: $3.60 South Korea: $8.80 USA: $7.20 Iran: $1.25 Libya: $1.00 Japan: $8.70 China: $6.30 Qatar: $1.80 Mexico: $6.85 Oman: $1.00 India: $3.70 Saudi Arabia: $0.75 Trinidad: $1.65 Brazil : $4.90 Bolivia: $1.85 Global Natural Gas Costs – 1st Quarter 2007($US per million BTUs) Argentina: $4.85 Source: ACC
RES PRICING Source: Evonik Industries * Prices as of May 24th , 2007, Bio-Ethanol price for Brazil
11 14 13 15 12 10 9 8 16 17 7 6 18 5 19 4 3 52 22 25 23 2 35 21 20 26 1 27 36 37 34 29 28 38 33 30 41 31 49 70 53 52 54 42 50 47 71 43 32 51 44 72 39 45 55 73 56 57 114 48 46 40 60 74 58 113 61 75 112 59 111 62 64 65 76 110 63 68 66 77 109 69 78 67 108 79 107 106 80 95 94 932 92 81 105 96 104 82 91 83 102 103 90 97 100 101 99 98 84 89 85 86 87 88 CZECH „BIOGAS COVERAGE“
TRENDS IN RENEWABLE IN CHEMISTRY AGROFERT forecasts future replacement cheapest bio compounds used as motor fuel by other more sophisticated applications AGROFERT expects future coexistence of biofuel IG and IIG due existing synergies (use of byproducts from IG as feedstock for IIG)
Taking off curve of the Ren. Energy Sources in the EU and reaction of AGROFERT Group ??? R&D center for Biomas to Syngas • Tender announcement regarding to the „BIOMASS TO ENERGY“ project • 2-4 biogas production units projects Decision about investing into the production of Ist gen. biofuels, 400. 000 mt source material, 100.000 biofuels, 230.000 energetic product
AGROFERT GROUP: REACTION TO THE TREND Biomass sources in the Group (as of 2008) 780 000 mt/y of Biomass I. Gen. Biofuels Biogas plants Biomass to energy R&D Biomass to Syngas
Loading unloading Rapeseed, meal storage Oil mill, extraction FAME Glycerin production Product storages SHARED BIO/CHEMICAL HUB POWER GENERATION PLANT FERTILISER PRODUCTION PLANT
GHG EMISSIONS, CZ CASE • Total emissions from the biodiesel production chain calculated according newly issued sustainable criteria by EU • GHG Emission Savings • EF = 83.8 g CO2 / MJ (RED) • EB = 47.49 g CO2 / MJ GHG savings = (EF – EB) / EF GHG savings = 43.33 %