Download

1 / 12
120 likes | 508 Views
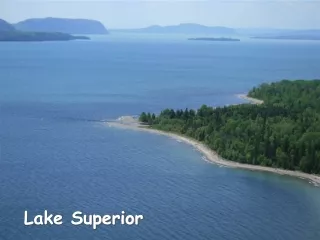
Lake Superior Water Clarity. Analysis of Water Clarity in Lake Superior using MODIS Images Yan Wang, Beth Peterson Forest Resources 3262 / 5262 Remote Sensing of Natural Resources and Environment 12/10/12. Objective. Analyze water quality in Lake Superior near Duluth 2011 and 2012

E N D
Lake Superior Water Clarity Analysis of Water Clarity in Lake Superior using MODIS Images Yan Wang, Beth Peterson Forest Resources 3262 / 5262 Remote Sensing of Natural Resources and Environment 12/10/12
Objective • Analyze water quality in Lake Superior near Duluth • 2011 and 2012 • June – September • Evaluate the effectiveness of MODIS data for determining water clarity • Evaluate the compatibility of MODIS data with field data from streams.
MODIS Data • Satellite Aqua (as opposed to Tera) • ~18:50 passover time • Product: MDY09A1 • bands 1–7 • 500m resolution • 8 day composite (reduce cloud cover) • Use bands 1 and 3 (red and blue) • 8 images per month (4 in each band) • Extracted: DN of the point at each site where field data was collected
Field Data • Turbidity Recorded as Nephelometric Turbidity Units (NTU) • Turbidity data from Lake Superior Streams • ~7 streams (depending on availability) • Data recorded ~every 15 minuites • Latitude and Longitude for each site • Extracted: average of data collected at 18:30, 18:45, 18:90 for all 8 days of each image
Preprocess • Geometry correction, atmospheric correction : MRT tool • ArcGIS: clip image and extract DN value of field samples from image • Process field sample of turbidity
Regression Analysis Y=ln(field) X=(B3-B1)/(B3+B1)
Results: Algorithms 2011 2012
Results: 2011 Images July June August September
Results: 2012 Images June July August September
Accuracy Assessment July 2012
Discussion • Regression analysis produced very poor results. • Streams were too small in comparison to MODIS pixels • Missing or inaccurate turbidity data • Turbidity values near the shore were different than values for the center of the lake. • Much more variability in 2012, possibly as a result of the large flood that occurred early in the year