Download
1 / 49
600 likes | 874 Views
Integrative omics analysis. Qi Liu Center for Quantitative Sciences Vanderbilt University School of Medicine qi.liu@vanderbilt.edu. Content. Introduction Data Sources Methods Tools Things to be aware. Why?. http://jdr.sagepub.com/content/90/5/561.

E N D
Integrative omics analysis Qi Liu Center for Quantitative Sciences Vanderbilt University School of Medicine qi.liu@vanderbilt.edu
Content • Introduction • Data Sources • Methods • Tools • Things to be aware
Why? http://jdr.sagepub.com/content/90/5/561
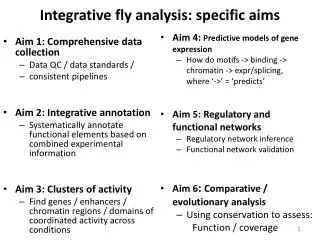
What? at least two different types of omics data Patient Technologies Data Analysis Integration and interpretation point mutation Small indels Further understanding of cancer and clinical applications Genomics WGS, WES Copy number variation Functional effect of mutation Structural variation Differential expression Network and pathway analysis Transcriptomics RNA-Seq Gene fusion Alternative splicing RNA editing Integrative analysis Methylation Epigenomics Bisulfite-Seq ChIP-Seq Histone modification Transcription Factor binding
Objectives • Understand relationships between different types of molecular data • Understand the phenotype • latent: disease subtype • Observable: patient outcome
Data sourcesTCGAhttps://tcga-data.nci.nih.gov/tcga/ http://www.nature.com/ng/journal/v45/n10/full/ng.2764.html
Firehose http://gdac.broadinstitute.org/
ENCODEhttp://genome.ucsc.edu/ENCODE/ http://genome-mirror.duhs.duke.edu/ENCODE/ http://www.nature.com/news/encode-the-human-encyclopaedia-1.11312
Methods • Sequential or overlap analysis • Clustering • Correlation analysis • Linear regression • Network based analysis • Bayesian • …..
Sequential or overlap analysis • Confirmation or refinement of findings • Each data are independently analyzed to get a list of interesting entities • Lists of interesting entities are linked together • Chin, K. et al. Genomic and transcriptional aberrations linked to breast cancer pathophysiologies. Cancer Cell 10, 529–541 (2006). • Lando, M. et al. Gene dosage, expression, and ontology analysis identifies driver genes in the carcinogenesis and chemoradioresistance of cervical cancer. PLoS Genet. 5, e1000719 (2009). • Beroukhim, R. et al. The landscape of somatic copy-number alteration across human cancers. Nature 463, 899–905 (2010).
Correlation analysis Reveal the relationships between different molecular layers • The strength of association indicates in trans-regulation.
Integrative method GSE10843 miRNA-mRNA correlation mRNAi mRNA decay GSE10833 protein/mRNA ratio miRNA-ratio correlation Translational repression microRNA 79 miRNAs miRNA-protein correlation protein Combined effect 5144 genes microRNA-target interactions Sequence features on site efficacy Significant inverse Correlation (p<0.005) 7235 functional relationships Association of sequence features with estimated mRNA decay or translation repression Binding evidence Supported by TargetScan, miRanda or MirTarget2 Site type Local AU-context 580 interactions 60miRNAs 423 genes microRNA-target interactions Additional 3’ pairing Site location the relative contribution of translation repression
Features on site efficacy for these two regulation types mRNA decay : 8mer is efficient Tanslationalrepression : 8mer site do not show significant efficacy mRNA decay : 3’UTR>ORF>5’UTR translational repression : marginal significance in ORF
Features on site efficacy for these two regulation types 3’ pairing enhance mRNA decay , but disfavor efficacy for translational repression AU-rich context appears to favor both mRNA decay and translational repression
miRNA-target Interactions 60 miRNAs , 423 genes 580 interactions , in which 332 (57.2%) was discovered by the integration of proteomics data miRNA-protein miRNA-mRNA miRNA-ratio Function miRNA-protein 156 29 31 5 147 TargetScan 212 0 Sequence miRanda MirTarget2 miRNA-mRNA • miRNA-ratio
miR-138 prefers translational repression SW620 and SW480 (derived from the same patient)
Linear regression • Estimate the strength of association between different data • Predict the outcome by modeling the combined effect of multiple types of data
Linear regression • Linear regression • Ridge—L2 penalized • Lasso—L1 penalized • Elastic net—L1+L2 penalized
Clustering Unsupervised clustering of omics data to find inherent structures • Using common latent variables among all data types
Network based analysis --using inferred networks or known network interactions to guide analysis
Illustrative example of SNF steps The advantage of the integrative procedure is that weak similarities (low-weight edges) disappear, helping to reduce the noise, and strong similarities (high-weight edges) present in one or more networks are added to the others. Additionally, low-weight edges supported by all networks are retained depending on how tightly connected their neighborhoods are across networks.
Patient similarities for each data types compared to SNF fused similarity
Methods Extension to more than 2 data types
Tools • Sequential or overlap analysis • Clustering • R package icluster, iclusterPlus • Correlation based • Linear regression • http://cbio.mskcc.org/leslielab/RegulatorInference • R package glmnet • Network based • R package SNFtool • Bayesian • …..
Visualization: Circular map for omics data Chen et al. Cell 2012, 148(6):1293-1307
Circos plot Circos http://circos.ca/intro/genomic_data/ Rcircos http://cran.r-project.org/web/packages/RCircos/index.html OmicCircos http://www.bioconductor.org/packages/release/bioc/html/OmicCircos.html
Things to be aware • The importance • The challenge in integrative analyses • Dimensionality • Integration attempts are best carried out using known biological knowledge
References • Kristensen VN. et al.Principles and methods of integrativegenomic analyses in cancer. Nat Rev Cancer. 2014, 14(5):299-313 • Wang B, et al. Similarity network fusion for aggregating data types on a genomic scale. Nat Methods. 2014 ,11(3):333-7. • Yuan Y, et al. Assessing the clinical utility of cancer genomic and proteomic data across tumor types. Nat Biotechnol. 2014 Jul;32(7):644-52. • Shen R, et al. Integrative clustering of multiple genomic data types using a joint latent variable model with application to breast and lung cancer subtype analysis. Bioinformatics. 2009 Nov 15;25(22):2906-12. • Liu Q, et al. Integrative omics analysis reveals the importance and scope of translational repression in microRNA-mediated regulation. Mol Cell Proteomics. 2013,12(7):1900-11. • Setty M, et al. Inferring transcriptional and microRNA-mediated regulatory programs in glioblastoma. MolSyst Biol. 2012;8:605 • LappalainenT. et al. Transcriptome and genome sequencing uncovers functional variation in humans. Nature 2013, 501, 506–511 • Jacobsen A, et al. Analysis of microRNA-target interactions across diverse cancer types. Nat StructMol Biol. 2013 , 20(11):1325-32.