Download
1 / 22
260 likes | 562 Views
RiskCity Exercise: Spatial Multi Criteria Evaluation for Vulnerability and Risk Assessment. Cees van Westen United Nations University – ITC School for Disaster Geo-Information Management International Institute for Geo-Information Science and Earth Observation (ITC) Enschede, The Netherlands

E N D
RiskCityExercise:Spatial Multi Criteria Evaluation for Vulnerability and Risk Assessment Cees van Westen United Nations University – ITC School for Disaster Geo-Information Management International Institute for Geo-Information Science and Earth Observation (ITC) Enschede, The Netherlands E-mail: westen@itc.nl Associated Institute of the ISL 2004
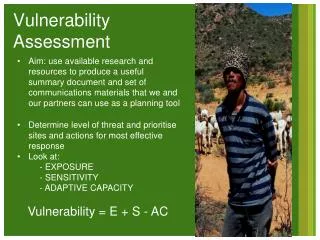
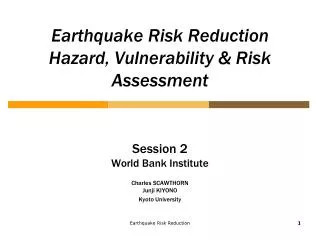
Loss estimation methods • Qualitative: • Overlay of hazard footprints and elements at risk • Using a simple matrix approach • Using indicator analysis ( e.g. SMCE) • Using risk indices • Semi-Quantitative: • Scenario-based loss estimation • Probabilistic loss estimation • Effect trees (what if) • R = H * V * A • Quantitative (QRA) • Based on economic losses • Involving direct and indirect losses RISK = HAZARD * VULNERABILITY * AMOUNT ISL 2004
Flow chart of the procedure RISK = HAZARD * VULNERABILITY CAPACITY ISL 2004
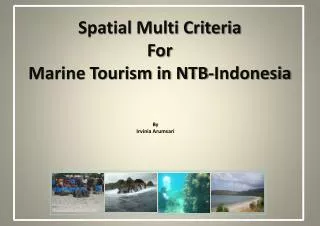
Spatial Multi-Criteria Evaluation ISL 2004
Indicators 1. Generic social vulnerability indicators: • Percentage of young children • Percentage of elderly people • Percentage of minority groups • Percentage of single parent households • Percentage of households living below poverty level. • Literacy rate 2. Hazard specific social vulnerability indicators • people located in flood risk zones, both a daytime and nighttime scenario • people located in landslide risk zones, both a daytime and nighttime scenario • people located in technological risk zones, both a daytime and nighttime scenario • people located in seismic risk zones, both a daytime and nighttime scenario 3. Hazard specific physical vulnerability indicators • buildings located in flood risk zones, with different return periods • buildings located in landslide risk zones, with different degree of susceptibility to landslides • buildings located in technological risk zones, with different degree of susceptibility to landslides • buildings located in seismic risk zones, with different intensities and return periods 4. Capacity indicators • Distance to Evacuation sites • Distance to hospitals. • Awareness ISL 2004
Procedure ISL 2004
Input data • This exercise uses the results of the loss estimation exercises done earlier for landslides, floods, earthquakes and technological hazards. ISL 2004
Different levels of aggregation • Districts • Wards • Census tracts • Mapping units • City blocks • Basic units for risk • Building footprints • Unemployment • Literacy rate ISL 2004
Indicators 1. Generic social vulnerability indicators: • Percentage of young children • Percentage of elderly people • Percentage of minority groups • Percentage of single parent households • Percentage of households living below poverty level. • Literacy rate ISL 2004
Indicators 2. Hazard specific social vulnerability indicators • people located in flood risk zones, both a daytime and nighttime scenario • people located in landslide risk zones, both a daytime and nighttime scenario • people located in technological risk zones, both a daytime and nighttime scenario • people located in seismic risk zones, both a daytime and nighttime scenario ISL 2004
Steps in the exercise • Step 1: Generation in SMCE of a criteria tree for Generic Social Vulnerability Indicators, with the groups of factors. • Step 2: Generation in SMCE of a criteria tree for Hazard specific social vulnerability indicators, with the groups of factors related to population affected by earthquakes, landslides, flooding and technological disasters in a daytime, and nighttime scenario. • Step 3: Generation in SMCE of a criteria tree for Hazard specific physical vulnerability indicators, with the groups of factors related to buildings affected by earthquakes, landslides, flooding and technological disaster scenarios. • Step 4: Generation in SMCE of a criteria tree for Capacity indicators, which in this case are the distance to emergency centers (e.g. hospitals or fire stations) and the level of awareness. • Step 5: Combination of the 4 sets of indicators into an overall vulnerability indicator. ISL 2004
SMCE process • Identification of the main goal. • Identification of a hierarchy of sub goals. • Identification of criteria or effects, which measure the performance of the sub goals. • Creating and filling a criteria tree, which represents the hierarchy of the main goal, any sub goals, and the criteria. • Identification of alternatives to be evaluated. • Assignment of input maps to criteria for each alternative. • Determination of a standardization method per criterion. • Weighing of criteria in the criteria tree. • Calculation of the Composite Index maps and visualization. • Classifying or slicing the Composite Index maps and visualization. • Calculation of Shape Index and/or Connectivity Index. ISL 2004
The criteria tree ISL 2004
The criteria tree ISL 2004
Spatial multi-criteria analysis A criteria tree contains all criteria Factors: a criterion that contributes to a certain degree to the output • Benefits • contributes positively to the output; the more you have (the higher the values), the better it is • Costs • contributes negatively to the output; the less you have (the lower the values), the better it is Constraints: criterion that determines in the calculation of the main goal .Mask out area ISL 2004
Criteria tree: Generic Social Vulnerability • Generate Criteria Tree: • Factors: Age related, Income Related, Ethnicity related, Social structure • Link with attributes in tables • Standardization • Weighting • Optional: constraint ISL 2004
Standardization of criteria • Maximum: The input values are divided by the maximum value of the map • Interval: Linear function with the maximum and minimum values of the map • Goal: Linear function with a specified maximum and minimum values • Piecewise linear: Linear function with two breaking points located between the extremes • Convex: Convex function with one user defined value to re-shape the curve • Concave: Concave function with one user defined value to re-shape the curve • U-Shape: U-shape curve with one user defined value to stretch or shrink the curveGaussianBell-shape curve with one user defined value to stretch or shrink the curve ISL 2004
How to select weights? • Direct estimation by expert • The user has to specify weight values him/herself. These user-defined weights are automatically normalized • Pair-wise comparison • With a pairwise comparison matrix, each variable (or criterion) is compared to all others in pairs in order to evaluate whether they are equally significant, or whether one of them is somewhat more significant / better than the other for the goal concerned • Ranking method • the criteria and variables are simply ranked according to their importance as landslide controlling factors • Source: ILWIS Multi Criteria Evaluation ISL 2004
Criteria tree ISL 2004
Final combination • The overall vulnerability indicator is made by combining the four indicator that we have calculated thus far: • A. Generic_Social_Vulnerability (exercise 8.1) • B. Population_Vulnerability (exercise 8.2) • C. Physical_Vulnerability (exercise 8.3) • Capacity (exercise 8.4) • Combine A,B,C with SMCE Final Vulnerability := Vulnerability / Capacity ISL 2004
Thank you ISL 2004