Download
1 / 52
530 likes | 543 Views
Tools Related to Compiler Backends. Manish Vasani Department of Computer Science Columbia University COMS W4115 – Programming Languages and Compilers April 14, 2010. Outline. Compiler Backend Frameworks Purpose Design Philosophy Examples & Case study Pointer Analysis

E N D
Tools Related toCompiler Backends Manish Vasani Department of Computer Science Columbia University COMS W4115 – Programming Languages and Compilers April 14, 2010
Outline • Compiler Backend Frameworks • Purpose • Design Philosophy • Examples & Case study • Pointer Analysis • Implementing using compiler frameworks • Debuggers • High level working: • Call stacks, breakpoints, locals/params, source view, etc. • Role of compiler backend
Additional Slides • Metrics of success for shipping compilers: • Code Quality or Performance of target code • Build Throughput or Compile time • Optimized Code Debugging
Let’s start with a simple program Can you point out an optimization opportunity? • #include "stdio.h" • int main(intargc, char* argv[]) { • int x = argc; • int *y = &x; • while (argc != 10) { • printf("%d", *y); • ++argc; • } • return argc; • } Loop hoist “*y”?
Let’s start with a simple program • #include "stdio.h" • int main(intargc, char* argv[]) { • int x = argc; • int *y = &x; • tmp = *y; • while (argc != 10) { • printf("%d", tmp); • ++argc; • } • return argc; • }
Loop hoist optimization • Goal: Move loop invariant expressions outside the loop • What are the basic high-level steps for such an optimization? • Identify loops in a function • Iterate instructions in a loop • Look at operands, symbols and types • Identify loop invariant expressions • Modify IR (intermediate representation)
Our Focus for today • Only Step 1: Identify loops in the program (Control Flow Analysis) • Input: • Intermediate code for the program • Output: • Number of loops in a program • For all loops (nested up to any level): • Start source line for the loop • Function name
Identify loops in a program • Steps: • Lex/Parse the input • Transform into format understood by the backend • Build a Control flow graph • Nodes Basic blocks • Edges Control transfers • Control Flow Analysis • Graph traversal: Iterate through Basic blocks • Say Depth first order • Edge traversal: Iterate through successor/predecessor edges • Edge properties • Forward, Back, Cross • Instructions: Iterate through instructions/operands
Guess… • How many lines of code would it take to implement it? • 1000+? • 100-1000? • Less than 100? • Your surprise assignment for this semester: Implement it in your compiler backend and find out! • Just kidding
Design • How would you design it though? • Recommendation: Use Compiler frameworks • Your friends: You don’t need to implement most of the building blocks! • Provides infrastructure for implementing: • Entire Compiler backend • Specific parts of backend • Optimization phases • Code Instrumentation phases • Code Analysis tools • Binary Raise tools
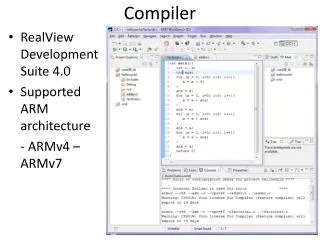
Current Compiler Infrastructures • Microsoft Phoenix Compiler Framework • Under development over the last decade • Phoenix framework based Code Analysis tools shipping in Visual Studio 2010, compiler under development • LLVM: Low level virtual machine compiler infrastructure • Open source • Under development over the last decade at UIUC • Widely used for compilers research at various universities • SUIF, Rose, Etc.
Common Philosophy • Libraries • Expose object model for compiler constructs • Expose commonly used compiler algorithms • Modular • Extensible • Configurable
Philosophy Front End • Phase/Pass based architecture • Plug-in architecture: • Write your custom pass • Plug-in the phase into existing pass chain • Researchers should do research, not plumbing! IL Reader TypeChecker LoopOpts Inliner RegisterAlloc Emitter
Case Study: Phoenix ProgramUnit or ModuleUnit (whole program) (single compiland) FuncUnit DataUnit Type Table Symbol Table FuncUnit DataUnit FuncUnit DataUnit FuncUnit FuncUnit FuncUnit FuncUnit Symbol Table Data Instrs FuncUnit FuncUnit Instruction Stream Flow Graph Region Graph Alias Info Exception Handling Info Phoenix Based Compiler And Tool Object Model
Compilers Tools Browser Visualizer Lint HL Opts HL Opts HL Opts LL Opts LL Opts LL Opts Code Gen Code Gen Formatter Obfuscator Refactor Xlator Profiler SecurityChecker Phx APIs Phoenix Core AST IR Syms Types CFG SSA assembly Native Image C++ IR C++AST Phx AST Profile C++ PREfast Lex/Yacc C# VB C++ Delphi Cobol Eiffel Tiger
Identifying loops in a program • Second round of guesses. How many lines of code would it take to implement it? • 1000+? • 100-1000? • Less than 100? • Let’s find it out!
Code BB1 BB1 • void MyCustomPhase::Execute(Unit unit) { • Phx.FunctionUnit functionUnit = unit.AsFunctionUnit; • functionUnit.BuildFlowGraph(); • Phx.Graphs.FlowGraph cfg = functionUnit.FlowGraph; • cfg.BuildDepthFirstNumbers(); • foreach (Phx.Graphs.BasicBlock bb in cfg.BasicBlocks) { • foreach (Phx.Graphs.FlowEdge edge in bb.SuccessorEdges) { • if (edge.IsBack) { • Phx.Graphs.BasicBlock headblock = edge.SuccessorNode; • Phx.IR.Instruction instr = headblock.FirstInstruction; • Console.WriteLine("Found loop: Function: {0}, File: {1}, Line: {2}", • Phx.Utility.Undecorate(functionUnit.NameString, false), • functionUnit.DebugInfo.GetFileName(instr.DebugTag), • functionUnit.DebugInfo.GetLineNumber(instr.DebugTag)); • } • } • } • functionUnit.DeleteFlowGraph(); • } BB2 BB3 BB3
Pointer Analysis • Implementing custom pointer analysis phase using LLVM: Extensibility • Pointer Analysis is a static code analysis technique that establishes which pointers, or heap references, can point to which variables or storage locations int x, *w, **z; z = &w; *z = &x; z w x
Pointer Analysis int main() { int x, y, *v, *w, **z; z = &w; *z = &x; z = &v; *z = &y; } z w v x y Does single pass always work?
Pointer Analysis int main() { int x, y, *v, *w, **z; z = &w; *z = &x; z = &v; while (…) { *z = &y; z = &w; } } z w v x y Flow Sensitive Analysis 1) Precise 2) Slow 3) Points to set for every program point
Pointer Analysis int main() { int x, y, *v, *w, **z; z = &w; *z = &x; z = &v; while (…) { *z = &y; z = &w; } } z w v x y Flow Insensitive Analysis • Fast • Imprecise • Conservative
Pointer Analysis Research • Hybrid Approach • Start with a conservative points-to set using a fast imprecise algorithm (e.g. flow insensitive) • Implement custom analysis phase that refines the points-to set z w v Custom FlowInsensitive x y
LLVM (Low Level Virtual Machine) • A compilation strategy designed to enable effective program optimization across the entire lifetime of a program. LLVM supports effective optimization at compile time, link-time (particularly interprocedural), run-time and offline (i.e., after software is installed). • A virtual Instruction set: LLVM is a low-level object code representation that uses simple RISC-like instructions, but provides rich, language-independent, type information and dataflow (SSA) information about operands. This combination enables sophisticated transformations on object code, while remaining light-weight enough to be attached to the executable. • A compiler infrastructure - LLVM is also a collection of source code that implements the language and compilation strategy
Pointer analysis with LLVM • LLVM: Provides a framework for writing custom pointer analysis phases • Custom phase only needs to implement minimal functionality: • Register phase • Plug-in phase • Initialize phase • Override the primary points-to function
Pointer Analysis with LLVM • In the box: standard pointer analysis algorithms (flow insensitive analysis) • Chaining: • Ability to invoke multiple pointer analysis phases in sequence • Our custom phase only needs to worry about refining the points-to set, not creating or maintaining it
Resources • Phoenix: http://en.wikipedia.org/wiki/Phoenix_(compiler_framework) • LLVM: http://llvm.org/ • ROSE: http://en.wikipedia.org/wiki/ROSE_compiler_framework • SUIF: http://suif.stanford.edu/suif/suif2/
Our focus for today • Basic working of source level debuggers: • Generating call stacks • Breakpoints • AddWatch for variables • Primary debugger event loop
Overview • Dynamic Information (Run time: OS provided) • Current Instruction Pointer (IP) • Debuggee Process Info • Process ID • Register Context • Process Memory • Loaded Modules/Libraries (exe, dll, etc.) • Static Information (Compile time generated) • Compiler generated DebugInfo
DebugInfo • Information generated by compiler backend/linker for debugging support • Database of tables: • Types • Symbols • Locations • Source Line Numbers • Source File Info • Compilation environment, command line, etc. • Stored in standard formats: e.g. DWARF is one of the standard debug file format used my many C/C++ compilers (gcc -g)
Sample test code // main.cpp main.exe (Module 1) __declspec(dllimport) int dll_method1(inti); int main(intargc) { return dll_method1(argc); } ------------------------------------------------------------------------------------------------------ // dll1.cpp dll1.dll (Module 2) __declspec(dllexport) int dll_method1(inti) { return dll_method2(i); } int dll_method2(inti) { __debugbreak(); return i; } main dll_method1 dll_method2
Call Stack dll1.dll!dll_method2(int i=1) at line 7, dll1.cpp dll1.dll!dll_method1(int i=1) at line 4, dll1.cpp main.exe!main(int argc=1) at line 5, main.cpp main.exe!mainCRTStartup at xxx bytes • Components of each stack frame • Generating them from: • Debuggee Runtime Info • Compiler generated Debug Info
Relative Virtual Address (RVA) • Current IP or Virtual Address (VA) = 0x3600h • Module Loaded at VA = dll1.dll • Base Virtual address of module at IP = 0x3000h • Current Relative Virtual Address (RVA) = 0x600h Virtual Address Space 0x5000h dll1.dll IP 0x3600h 0x3000h main.exe 0x1000h
Relative Virtual Address (RVA) • Importance • Used for referring to address offsets within a module • Generated at compile time • RVAs act as primary keys for many DebugInfo database tables
Example: Source Line table 1 2 3 4 // dll1.cpp dll1.dll (Module 2) __declspec(dllexport) int dll_method1(int i) { return dll_method2(i); } 00000010: push ebp 00000011: movebp,esp 00000013: moveax,dwordptr [ebp+8] 00000016: push eax 00000017: call ?dll_method2@@YAHH@Z 0000001C: add esp,4 0000001F: pop ebp 00000020: ret
dll1.dll ! dll_method2 (inti=1) at line 7, dll1.cpp • Debuggee Runtime Info: • Instruction Pointer (IP) • Module Name • IP or Virtual address (VA) -> Module • Module Base Virtual Address (Load address) • Module -> Base VA • Base Pointer (BP), Stack Pointer (SP) • Register Context • Read Process Memory • Return Address to process next stack frame • Compiler generated debug info • Function Name • VA - Base VA -> Relative VA (RVA) • RVA, Module -> Function Symbol (from Symbol table) • Type table, Symbol Table (per module/function) • Function Symbol -> Locals/Params Symbols & Types • Location (register/stack) • Local Symbol -> Register ID/Base Register ID + Offset • Source line number • RVA-> Source Line (from Line number table) • Source file name • RVA -> Source File (from Source file table)
Breakpoints // dll1.cpp dll1.dll (Module 2) __declspec(dllexport) int dll_method1(inti) { return dll_method2(i); } 00000010: push ebp 00000011: movebp,esp 00000013: moveax,dwordptr [ebp+8] 00000016: push eax 00000017: call ?dll_method2@@YAHH@Z 0000001C: add esp,4 0000001F: pop ebp 00000020: ret SetBreakpoint (SourceFile, SourceLine) for each Module loaded in debuggee address space (RunTime Info) for each SrcFile in SrcFileTable of the Module (CompileTime DebugInfo) if SourceFile == SrcFile (CompileTime DebugInfo) SrcLineTable = SourceLineTable (SrcFile) (CompileTime DebugInfo) RVAList = Lookup (SrcLineTable, SourceLine) (CompileTime DebugInfo) StartRVA = Head (RVAList) (CompileTime DebugInfo) VA = StartRVA + BaseVA (RunTime Info) WriteProcessMemory (VA, “int 3”) (RunTime Info)
Another example: Watch window • AddWatch(Local Variable Name) • IP or VA -> Module • If Module’s DebugInfo available AND not loaded • Load DebugInfo (Module) • VA -> RVA • RVA -> Function Symbol • Function Symbol -> Local Symbol (By Name) • Local Symbol -> Type (Type Table) • Local Symbol -> Location -> Value
Debugger Main Loop • CreateProcess / AttachToProcess (DebuggeeFileName/ProcessID, DEBUG_PROCESS) • while (Wait For Debug Event != EXIT_PROCESS) • Handle different debug events: Exceptions (Access violation), CreateThread, etc. • Handle loader events: Load dynamic link library • Set/Clear breakpoints • Handle Breakpoint Event • Read DebuggeeRegisterContext • GenerateCallStack (IP) • Display Source File (IP) • Display locals/watch window
And lot more… • Other Debugging features: • Edit & Continue debugging: Incremental Linking • Expression Evaluator • Disassembly level debugging • Conditional breakpoints/Tracepoints • Remote debugging • Native/Managed interop debugging • User mode vs Kernel mode debugging • Crash dump or Post-Mortem debugging
Metrics of Success • New Language/Compiler • Compiles valid programs • Generates correct target code • Generates helpful error/warning messages • Shipping compilers • Code quality or Performance (code size & execution time of target code) • Build throughput (compile time) • Memory footprint
Code Quality (CQ) • Code Quality measures how good the compiled binary is, in terms of the execution time, code size, energy consumed, etc. • CQ analysis serves two purposes: exposing optimization opportunities and addressing regressions in a timely manner. • Benchmarks • SPEC (Standard Performance Evaluation Corporation) non-profit org to establish and endorse benchmarks • Micro-benchmarks • Real world code • C++ team at MS has a dedicated full time Performance team for measuring, analyzing and reporting CQ. Additionally, every developer needs to measure CQ impact of any significant code change prior to the check-in.
Build Throughput (TP) • Build Throughput is the time taken to compile and link the program • TP is as important as CQ • C++ compiler team at MS: Approx. half of the customer requests are to improve compiler/linker TP! • Tests: • Daily benchmark runs for TP • Weekly TP builds of Windows, SQL, Office • Greater than 1% TP regression blocks the check-in and needs to be analyzed
Relation between CQ and TP • Inversely proportional • Adding more optimizations improves CQ, but hurts the build TP • Need a fine balance of CQ gain vs TP overhead • Even a perfectly good and useful optimization for a certain code base could be completely useless for another • Challenge: Figuring out what optimizations to implement (or rather leave out) based on target customer usage
Importance of BE • CQ and TP are mainly owned and affected by the backend. • Front end (Parsing) takes up a significant chunk of build TP, but stabilizes over time. • Can you guess the ratio of FE devs:BE devs in the C++ team at MS? • Around 1:5 • BE plays a significant role!
Optimized Code Debugging • Why debug optimized code? • Program crash in shipped product with no concrete steps to reproduce the bug • Debug builds generate binaries and debug info files which are twice as big as optimized retail builds • Test passes in software companies happen on retail builds. Regenerating the same environment with patched debug builds is very painful and time consuming
Difficulties • Target code is vastly different from source code due to optimizations. Leads to bad debugging experience: • Local variables/parameters optimized away, CSE, Dead code elimination • Can’t trust locals/watch window • Function call inlining • Can’t trust call stacks • Code Motion, Code merge • Single stepping leads to cursor jumping around in the source file • Loop unrolling, Scope merging • Can’t trust source level scopes: Optimized code doesn’t respect source level scopes