Download
1 / 12
130 likes | 286 Views
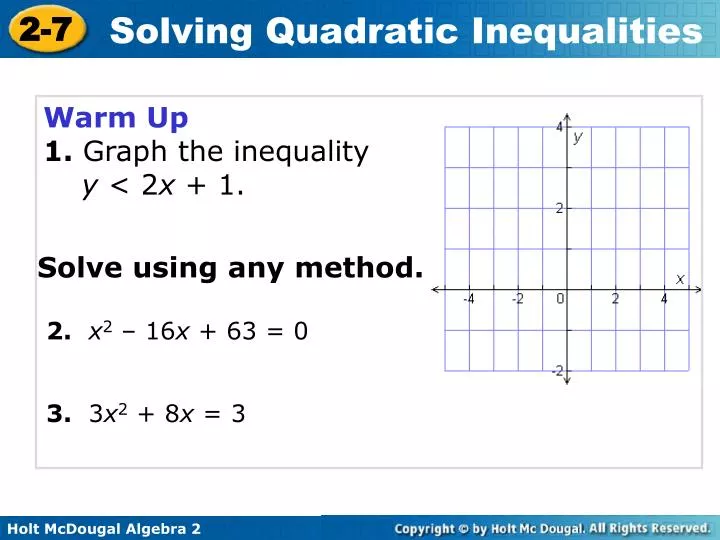
Warm Up 1. Graph the inequality y < 2 x + 1. Solve using any method. 2. x 2 – 16 x + 63 = 0. 3. 3 x 2 + 8 x = 3. Objectives. Solve quadratic inequalities by using tables and graphs. Solve quadratic inequalities by using algebra. Vocabulary. quadratic inequality in two variables.

E N D
Warm Up 1. Graph the inequalityy < 2x + 1. Solve using any method. 2. x2 – 16x + 63 = 0 3. 3x2 + 8x = 3
Objectives Solve quadratic inequalities by using tables and graphs. Solve quadratic inequalities by using algebra. Vocabulary quadratic inequality in two variables
A quadratic inequality in two variables can be written in one of the following forms, where a, b, and c are real numbers and a ≠ 0. Its solution set is a set of ordered pairs (x, y). y < ax2 + bx + c y > ax2 + bx + c y ≤ ax2 + bx + c y ≥ ax2 + bx + c
Example 1: Graphing Quadratic Inequalities in Two Variables Graph y ≥ x2 – 7x + 10.
Reading Math For and statements, both of the conditions must be true. For or statements, at leastone of the conditions must be true. Quadratic inequalities in one variable, such as ax2 + bx + c > 0 (a ≠ 0), have solutions in one variable that are graphed on a number line.
Example 2A: Solving Quadratic Inequalities by Using Tables and Graphs Solve the inequality by using tables or graphs. x2 + 8x + 20 ≥ 5 Use a graphing calculator to graph each side of the inequality. Set Y1 equal to x2 + 8x + 20 and Y2 equal to 5. Identify the values of x for which Y1≥ Y2.
–6 –4 –2 0 2 4 6 Example 2A Continued The parabola is at or above the line when x is less than or equal to –5 or greater than or equal to –3. So, the solution set is x ≤ –5 or x ≥ –3 or (–∞, –5] U [–3, ∞). The table supports your answer. The number line shows the solution set.
Example 2B: Solving Quadratics Inequalities by Using Tables and Graphs Solve the inequality by using tables and graph. x2 + 8x + 20 < 5
The number lines showing the solution sets in Example 2 are divided into three distinct regions by the points –5 and –3. These points are called critical values. By finding the critical values, you can solve quadratic inequalities algebraically.
Example 3: Solving Quadratic Equations by Using Algebra Solve the inequality x2 – 10x + 18 ≤ –3 by using algebra.
Critical values –3 –2 –1 0 1 2 3 4 5 6 7 8 9 Example 3 Continued Step 3 Test an x-value in each interval. x2 – 10x + 18 ≤ –3
Example 4: Problem-Solving Application The monthly profit P of a small business that sells bicycle helmets can be modeled by the function P(x) = –8x2 + 600x – 4200, where x is the average selling price of a helmet. What range of selling prices will generate a monthly profit of at least $6000? Pg 114 12-46 even, 48-50,51,53,62-64