Download
1 / 16
160 likes | 165 Views
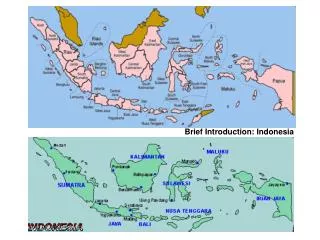
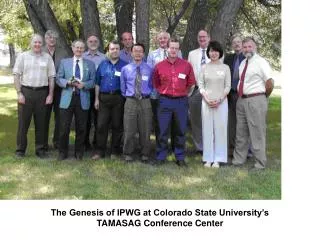
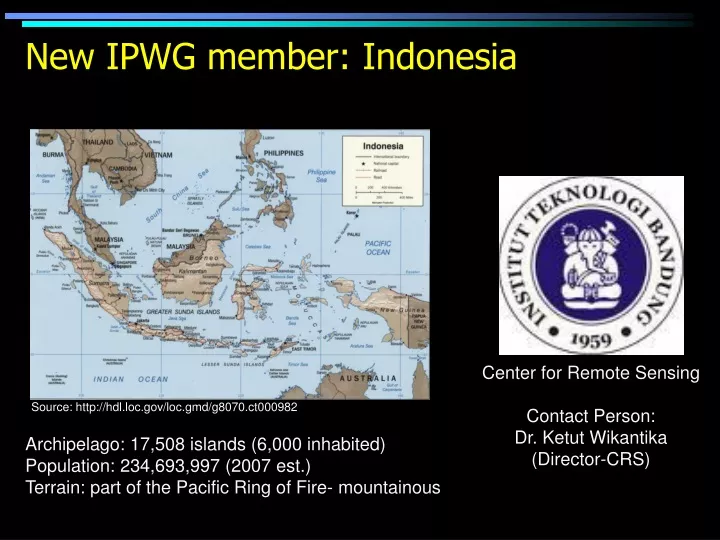
New IPWG member: Indonesia. Center for Remote Sensing Contact Person: Dr. Ketut Wikantika (Director-CRS). Source: http://hdl.loc.gov/loc.gmd/g8070.ct000982. Archipelago: 17,508 islands (6,000 inhabited) Population: 234,693,997 (2007 est.)

E N D
New IPWG member: Indonesia Center for Remote Sensing Contact Person: Dr. Ketut Wikantika (Director-CRS) Source: http://hdl.loc.gov/loc.gmd/g8070.ct000982 Archipelago: 17,508 islands (6,000 inhabited) Population: 234,693,997 (2007 est.) Terrain: part of the Pacific Ring of Fire- mountainous
Estimation and evaluation of soil erosion using multitemporal spatial data Case Study: West Java Indonesia Darmawan S.1, Hirano A.2,Uchida S.2, Hadi F.1, Wikantika K.1 1)Center for Remote Sensing, Institut Teknologi Bandung, CRS-ITB Indonesia 2)Japan International Center for Agricultural Sciences (JIRCAS), Tsukuba Japan
Backgrounds • Soil functions : • - Regulating and partitioning water and solute flow • - Filtering, buffering, degrading, immobilizing, and detoxifying • - Sustaining plant and animal life below and above the surface • - Storing and cycling nutrients • Soil erosion effects : • Soil degradation, pollution, agricultural production and regional income • Soil erosion models • USLE, RUSLE-1, RUSLE-2, MOSES, EUROSEM… • Image processing and GIS tools • Commercial & open source (GRASS)
Study Area West Java Province: 3.709.528 ha, 37 million people (most populated in Indonesia) and 30 % people in agriculture Study Area 104048-108048 Le 5050’-7050’ Ls Java sea Jakarta Banten Paddy field Bandung Environmental disaster Tea plantation Central java Hindia Ocean
USLE Mathematic model A = R x K x Ls x C x P A is the computed soil loss per unit area R the rainfall and runoff factor. K the soil erodibility factor. Ls the slope length-gradient factor. C the crop/vegetation and management factor. P the support practice factor. Soil erosion tolerance rate (Robert P., 2000)
C factor 9 2 5 2 6 2 5 2 7 8 2 4 6 8 3 2 P factor 2 5 2 6 2 5 2 4 5 6 9 3 2 2 5 7 4 2 7 9 3 6 7 1 7 8 2 4 6 8 3 4 2 1 2 3 5 6 2 8 6 7 2 4 5 5 6 5 K factor 7 4 5 9 2 4 7 6 3 7 8 2 4 6 8 5 5 2 5 2 6 2 5 2 9 6 7 8 6 3 2 1 3 R factor 8 4 5 6 3 4 5 3 7 8 2 4 6 8 3 2 2 5 2 6 2 5 2 5 5 6 9 3 2 2 5 7 Ls factor 1 8 7 9 3 6 7 4 7 8 2 4 6 8 3 6 3 1 9 4 5 9 8 8 5 3 7 8 8 7 3 3 Method GIS and Image Processing USLE Model Land Use Soil Soil erosion = CxPxKxRxLs Rainfall Soil erosion map in 1994, 1997, 2001, 2005 Slope
Slope in total area 0 - 16 = 81 % 16 - 30 = 13 % 30 - 100 = 6 % DEM and Slope Elevation in meter Elevation in total area Java sea 0 - 500 = 64 % 500 - 1500 = 33 % 1500 - 3000 = 3 % Jakarta Java sea Hindia ocean Slope in % In this case slope length 30 m Hindia ocean
Rainfall 1994 1997 2001 2005 Java sea Average Rainfall mm/year 1997 2001 1994 2005 Hindia ocean Rainfall mm/year Extreme Average rainfall 1994
Soil erosion in 1994,1997,2001,2005 based on river basin Ton/900m2/year Higher soil erosion in 2001 Cisadane Cimandiri Citarum Cisanggarung Cimandur Ciujung Cibareno
Conclusion • Soil erosion was very high in Cibareno River basin because changes from forest to agricultural area and agricultural area to palawija fields • Higher soil erosion in 2001 because of rainfall extreme • In Majalengka and Kuningan, low rainfall will cause high soil erosion because of steep slope
More important issue … Clean and drinking water
Dirty water kills Source: http://www.unwater.org/worldwaterday/flashindex.html
Sources of clean and drinking water • Poor water resources management ≈ poor land storage • More dependent on rain
Indonesia’s involvement the IPWG: • Good rain estimate is important for Indonesia: • Use of satellite estimates • Challenges in remote sensing estimates: • Land v. Water (17,508 islands) • Terrain (mountainous) • Land use (for instance, paddy field) • CRS-ITB can contribute on validation with around 4,000 rain gauges (manual)