Download
1 / 1
10 likes | 83 Views
Eighteen Years of Acid Wet Deposition at Mt. Mansfield. Introduction. Methods.

E N D
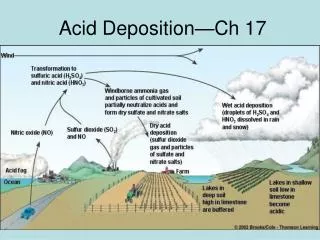
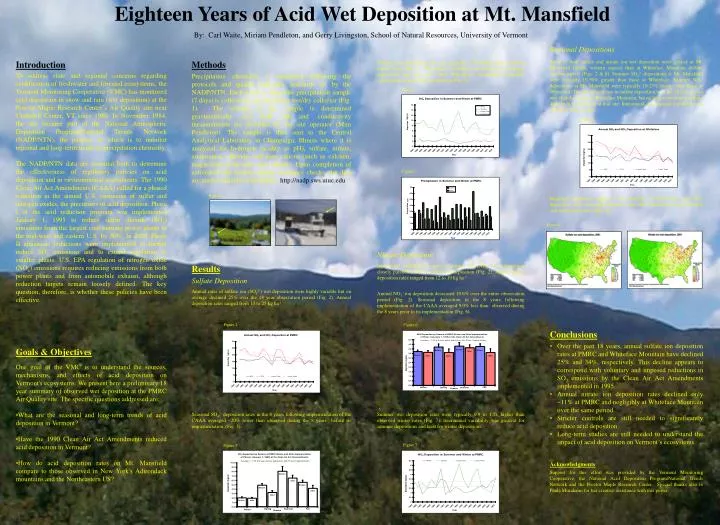
Eighteen Years of Acid Wet Deposition at Mt. Mansfield Introduction Methods Precipitation chemistry is monitored following the protocols and quality assurance standards set by the NADP/NTN. Each week a composite precipitation sample (7 days) is collected in an Aerochem wet/dry collector (Fig. 1). The volume of the sample is determined gravimetrically and field pH and conductivity measurements are recorded by the site operator (Mim Pendleton). The sample is then sent to the Central Analytical Laboratory in Champaign, Illinois where it is analyzed for hydrogen (acidity as pH), sulfate, nitrate, ammonium, chloride, and base cations (such as calcium, magnesium, potassium and sodium). Upon completion of automated and manual quality assurance checks, the data are made available to the public: http://nadp.sws.uiuc.edu. To address state and regional concerns regarding acidification of freshwater and forested ecosystems, the Vermont Monitoring Cooperative (VMC) has monitored acid deposition in snow and rain (wet deposition) at the Proctor Maple Research Center’s Air Quality site near Underhill Center, VT since 1980. In November 1984, the site became part of the National Atmospheric Deposition Program/National Trends Network (NADP/NTN), the purpose of which is to monitor regional and long-term trends in precipitation chemistry. The NADP/NTN data are essential both to determine the effectiveness of regulatory policies on acid deposition and in environmental assessments. The 1990 Clean Air Act Amendments (CAAA) called for a phased reduction in the annual U.S. emissions of sulfur and nitrogen oxides, the precursors of acid deposition. Phase I of the acid reduction program was implemented January 1, 1995 to reduce sulfur dioxide (SO2) emissions from the largest coal-burning power plants in the mid-west and eastern U.S. by 50%. In 2000, Phase II emissions reductions were implemented to further reduce SO2 emissions and to extend regulation to smaller plants. U.S. EPA regulation of nitrogen oxide (NOx) emissions requires reducing emissions from both power plants and from automobile exhaust, although reduction targets remain loosely defined. The key question, therefore, is whether these policies have been effective. Goals & Objectives • One goal of the VMC is to understand the sources, mechanisms, and effects of acid deposition on Vermont's ecosystems. We present here a preliminary 18 year summary of observed wet deposition at the PMRC Air Quality site. The specific questions addressed are: • What are the seasonal and long-term trends of acid deposition in Vermont? • Have the 1990 Clean Air Act Amendments reduced acid deposition in Vermont? • How do acid deposition rates on Mt. Mansfield compare to those observed in New York's Adirondack mountains and the Northeastern US? By: Carl Waite, Miriam Pendleton, and Gerry Livingston, School of Natural Resources, University of Vermont Regional Depositions Rates of both sulfate and nitrate ion wet deposition were greater at Mt. Mansfield (400m, western aspect) than at Whiteface Mountain (610m, eastern aspect) (Figs. 2 & 8). Summer SO42- depositions at Mt. Mansfield were typically 10-50% greater than those at Whiteface. Summer NO3- depositions at Mt. Mansfield were typically 10-25% greater than those at Whiteface. The rate of decrease in sulfate deposition over the 18 year period was slightly greater at Whiteface Mountain, but no long-term trend in nitrate deposition was evident at that site. Interannual and seasonal variability was similar at the two sites. Summer wet deposition rates are typically 3-5x higher than observed winter rates (Fig. 4). Interannual variability was greatest for summer depositions and least for winter depositions. Interannual variability corresponds in part with precipitation (Fig. 5). Figure 4 Figure 8 Figure 5 Figure 1 Regional summaries suggest a net decrease in both SO42- and NO3- deposition with increasing distance from their mid-western and Atlantic seaboard source areas (Fig. 9). Figure 9 Nitrate Deposition Interannual variability in rates of nitrate ion (NO3-) wet deposition closely paralleled that of sulfate ion deposition (Fig. 2). Annual nitrate deposition rates ranged from 12 to 19 kg ha-1 Results Sulfate Deposition Annual rates of sulfate ion (SO42-) wet deposition were highly variable but on average declined 25% over the 18 year observation period (Fig. 2). Annual deposition rates ranged from 13 to 25 kg ha-1 Annual NO3- ion deposition decreased 10.6% over the entire observation period (Fig. 2). Seasonal deposition in the 8 years following implementation of the CAAA averaged 9.0% less than observed during the 8 years prior to its implementation (Fig. 6). Figure 2 Figure 6 Conclusions • Over the past 18 years, annual sulfate ion deposition rates at PMRC and Whiteface Mountain have declined 25% and 34%, respectively. This decline appears to correspond with voluntary and imposed reductions in SO2 emissions by the Clean Air Act Amendments implemented in 1995. • Annual nitrate ion deposition rates declined only ~11% at PMRC and negligibly at Whiteface Mountain over the same period. • Stricter controls are still needed to significantly reduce acid deposition. • Long-term studies are still needed to understand the impact of acid deposition on Vermont’s ecosystems. Seasonal SO42- deposition rates in the 8 years following implementation of the CAAA averaged ~20% lower than observed during the 8 years before its implementation (Fig. 3). Summer wet deposition rates were typically 0.9 to 1.5x higher than observed winter rates (Fig. 7). Interannual variability was greatest for summer depositions and least for winter depositions. Figure 7 Figure 3 Acknowledgments Support for this effort was provided by the Vermont Monitoring Cooperative, the National Acid Deposition Program/National Trends Network and the Proctor Maple Research Center. Special thanks also to Paula Murakami for her creative assistance with this poster.