Download
1 / 21
210 likes | 383 Views
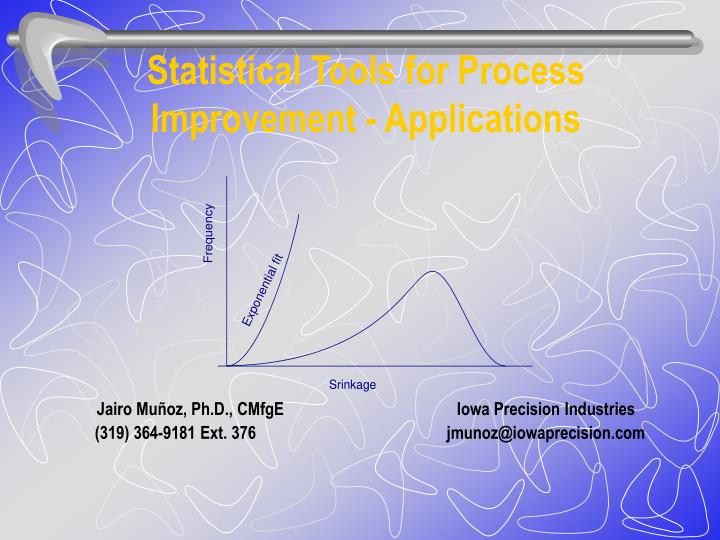
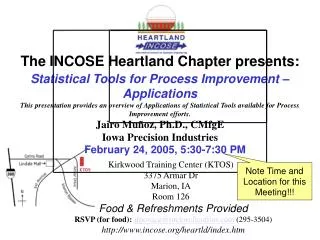
Statistical Tools for Process Improvement - Applications. Jairo Muñoz, Ph.D., CMfgE Iowa Precision Industries (319) 364-9181 Ext. 376 jmunoz@iowaprecision.com. Contents of Today’s Meeting. Statistical Tools for Process Improvement The Concept of Variation Process Capability

E N D
Statistical Tools for Process Improvement - Applications Jairo Muñoz, Ph.D., CMfgE Iowa Precision Industries (319) 364-9181 Ext. 376 jmunoz@iowaprecision.com
Contents of Today’s Meeting • Statistical Tools for Process Improvement • The Concept of Variation • Process Capability • Actual vs. Potential. • Example: Cut to length machinery. • The Role of Industrial Experimentation
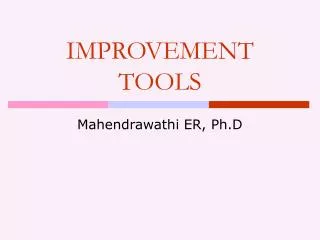
Values Vision Goals Objectives Strategies Improvement tools and awareness Mission Responsab. Activities Customers Suppliers Requirements Feedback Process Flow C/S Measures Requirements Baseline Feedback Analysis Improve ID the process Define boundaries Analysis Measure Solve/Test Implement Fool proof Monitor variation System change Benchmark Train Lessons learned Plan – Do – Check -- Act A METHOD FOR CONTINUOUS IMPROVEMENT Customer & Supplier Process analysis Problem solving Planning Hold the gains Maintain and improve what we’re doing right Make sure we’re doing the right things Make sure we’re doing things right Eliminate things that we’re not doing right
What is variation? • Variation is the inability to maintain a constant performance. • There is “natural” (NORMAL) variation. • There is “induced” (SPECIAL) variation. • Variation means $.
Seven Deadly Sins - Waste • Over-production & producing early • Delay • Transport(material handling) • Processing • Inventory • Motions • Defects
THE COST OF VARIATION Costs associated with producing a poor quality product. 22% 10% 68% Costs of assuring a good quality product
Are We Good Enough? At 99.9%: • 200,000 wrong drug prescriptions yearly • 15,000 newborns dropped in hospitals • Unsafe drinking water 1 hr each year • No utilities for 8.6 hrs each year • 2 short/long landings at all major airports each day • 500 incorrect surgical procedures weekly • 9 misspelled words on every page of every magazine
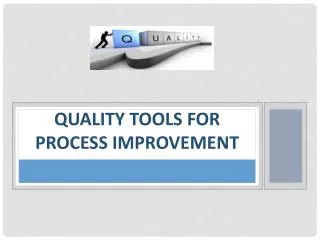
DOE, EVOP Implement needed changes Record process changes NO NO Yes Select condition needing to improve Define data to be collected Analyze current process NO Collect data Analyze data PARETO, SCATTER, REGRES’n Yes CHECK SHEETS PROCESS FLOW DIAGRAM BRAINSTORM CAUSE / EFFECT DIAGRAM Record unusual events Establish regular process monitoring CONTROL CHARTS STATISTICAL QUALITY CONTROL Yes More detail needed? Test process options Need for C/A? Improved enough?
NO Yes Is Process Capable? Yes NO SPC, Cp or DOE? Is Process Predictable? Check distribution. Decrease variability. Eliminate Special Causes of Variation Continue Production USE FACTORIAL DESIGNS
“The statistical approach focuses on problem-solving by providing a rational rather than emotional basis for decision-making. It provides the basis for on going improvement.” Dr. W.E. Deming
MEASURES • ENGINEERING • Percent documents issued on time; ECR’s per project. • PRODUCTION PLANNING • Actual/Planned deviation; Time lost waiting for parts. • MIS • Average response time; Data entry errors per _____. • PURCHASING • Purchases/sales ratio; Total dollars; Percent shortages.
Can’t Let Obstacles Slow Us • We tried that ten years ago • We’re too busy to fix these problems • We don’t do things that way here • But those companies aren’t like us • We have different problems • We’ll change, but let’s do it very slowly • That won’t work here
Process Capability • The output of a process in control (predictable)may be compared against its specification. • For measurement data, process capability indexes are usually expressed as a ratio of total variability and the specification range. • Percent defective may be predicted when the process capability is known for an “in control” process. • If the process capability is sufficiently high, end item inspection becomes a waste of time.
Cp = UTL – LTL = 1.33 = Ck 6 s Cp = 1.33; Ck = UTL – Mean = 0.5 3 s Process Variation Vs. Specifications Cp = 1.33; Ck = 0 Cp = 1.33; Ck < -1
Cp in Cut to Length Applications • Used as a sales tool • Used as a final test tool • Used by customer as a verification tool • Potential process capabilities of up to 2.1 in short runs (with tolerances of +/- 0.030”) • Actual process capabilities of up 1.7 in short runs. • Customer runs of up to 1.35 for +/- 0.005” machines
Process Fallout - Centered Process Six-sigma philosophy
References • Box and Draper, Evolutionary Operations. • Box, Hunter and Hunter, Statistics for Experimenters • Montgomery, Design and Analysis of Experiments • Snee, Hare and Trout, Experiments in Industry • Wheeler, Tables of Screening Designs • Wheeler, Understanding Industrial Experimentation • Software: • www.statease.com • MatLab; Design Ease; Design Expert; SAS.


![Seven Quality Tools [Statistical Process Control]](https://cdn3.slideserve.com/6416179/seven-quality-tools-statistical-process-control-dt.jpg)