Download
1 / 12
120 likes | 242 Views
Section 10-4. Graphing Multivariable functions. 1. Plot P(3, 5). Z. X. Y. Three Dimensional Cartesian Coordinate System. Coordinate Axis The x-axis appears to go from front to back the y-axis from left to right the z-axis from top to bottom

E N D
Section 10-4 Graphing Multivariable functions
Z X Y Three Dimensional Cartesian Coordinate System
Coordinate Axis The x-axis appears to go from front to back the y-axis from left to right the z-axis from top to bottom The positive x direction is from the origin forward The positive y direction is from the origin right The positive z direction is from the origin up
Octants The three axis divide the space into 8 octants. Four above the xy plane and four below the xy plane
Octants I. (x, y, z) II. (-x, y z) III. (-x, -y, z) IV. (x, -y, z) V. (x, y -z) VI. (-x, y, -z) VII. (-x, -y, -z) VIII. (x, -y, -z)
Z X Y Plot the points A( 2, 3, 5 ) B( 0, 5, 2 ) C( 2, -2, -4 )
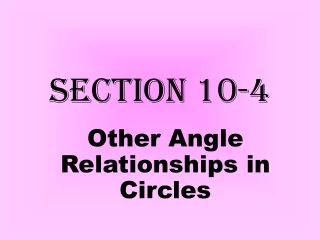
z y x 3. Graph the plane y = 5
z y x 4.
z y x 5.
Assignment: Practice 10-4