Download
1 / 14
140 likes | 355 Views
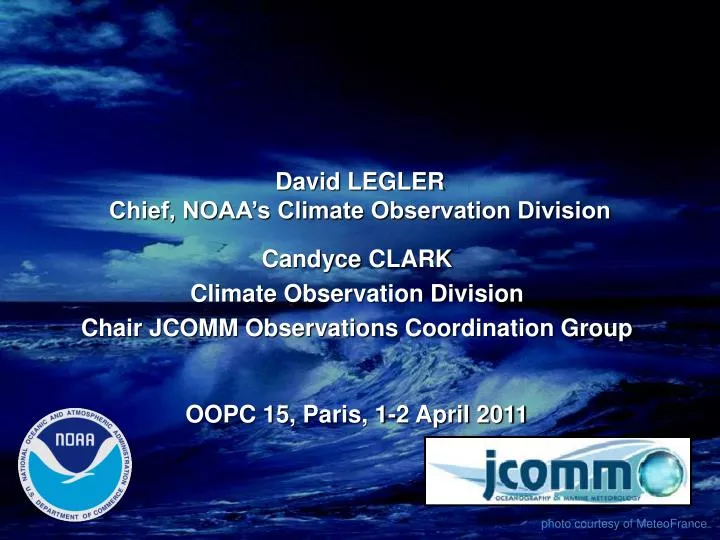
David LEGLER Chief, NOAA’s Climate Observation Division. Candyce CLARK Climate Observation Division Chair JCOMM Observations Coordination Group OOPC 15, Paris, 1-2 April 2011. photo courtesy of MeteoFrance. METRICS – definitions. from the Greek metrikos : in meter, by measure

E N D
David LEGLER Chief, NOAA’s Climate Observation Division Candyce CLARK Climate Observation Division Chair JCOMM Observations Coordination Group OOPC 15, Paris, 1-2 April 2011 photo courtesy of MeteoFrance
METRICS – definitions • from the Greek metrikos: in meter, by measure • OED: a poetic metre • Webster: a standard of measurement • Legler: • measurement against which progress is assessed • must be measureable • should be helpful to strengthen observing system • not the same as a climate diagnostic
Initial Global Ocean Observing System for Climate Status against the GCOS Implementation Plan and JCOMM targets Origin 62% Total in situ networks March 2011 100% 100% 59% 80% 100% 62% 73% 48% 34% Original goal: 100% implementation in 2010 System % complete
Observing System Status: Quarterly Report for Q4 2009 Ship observations not shown 100 80 Requirement: All boxes blue Drifting Buoys Moored Buoys Ships Total Goal: 100% Global Coverage 60 40 20 0 Percent of Weeks with 25 SST Observations in 5x5 Box Drifting Buoys + Moored Buoys + Weighted Ship Observations Percent of 5x5 Boxes with 25 Observations per Week
Evaluating the Ocean Observing System: Surface Currents FY10: ~50% of GOOS/GCOS goal for surface currents met. Largest gaps in shallow seas, divergence regions and some sectors of Southern Ocean. Research facilitated by this project: climate variations driving location of Brazil/Malvinas Current confluence as a function of time, 1980—present (figures from Lumpkin and Garzoli, J. Geophys. Res., in press). FY09 Q3 (July—September) report evaluating the GOOS’s performance for near surface current measurements Rick Lumpkin and Gustavo Goni, NOAA/AOML
Observing System Status: 2010, Q2 Temperature Profiles Sampling requirements: 1 profile Every 10 days In every 3 x 3 º BATHY (mostly XBTs) TRACKOB (surface underway data) TESAC (mostly Argo floats) BUOY (moored and drifting) Requirement: All boxes blue Goal: 100% Global Coverage
Metrics for the Climate Observing System – thoughts from David Legler • Type of metrics: • Input, Output, Process, Outcomes, Planning • NOAA has used JCOMM tracking of initial ocean observing system for climate based on GCOS IP – is it still helpful? • Different mix of metrics for different components? (funders, users, OOPC, JCOMM, etc) • Ways to use metrics: • Measure our progress and indicate magnitude of our challenges • Reflect the gross undersampling of the ocean for most variables • Reflect the increasingly growing demands expected for the OOS • Reflect the value and utilization of observations • QUESTION TO OOPC: HOW/WHAT METRICS ARE HELPFUL?
Input Metrics (resources put into the observation system) • Number of countries supporting OOS (e.g., number of countries involved in Argo) • Aggregate monetary contributions • Number of ships required/contributing to maintain OOS • Number of scientists (or suitable metric regarding capacity building) involved in observing activities
Output Metrics • Number of published papers that use obs systems • Number of products • Number of platforms or observations • Number of variables (ECVs) per platform • Volume of ocean/seas sampled • Number of routine reanalyses generated • New msmt techniques that lead to obs and products with increased resolution and/or accuracy
Process/system Metrics • Percent of obs transmitted in RT • Percent of obs available in RT • Percent of obs available after 2, 5, 10 yrs • Percent of obs that pass a QC test • Number of obs assimilated in assimilation system • Number of ship days required, deployed, etc • Percent of obs available through WDC-Oceanography • Adherence to data sharing policies
Outcome Metrics (require integration with modeling and analysis) • Reduction in climate forecast or analysis product (e.g., SST map) error • Variable based • Global ocean heat content (and uncertainty) • Global sea level rise (and uncertainty) • MOC transport estimates • Reanalyses products • Number of systems that are considered sustained or mature • Number of new technologies adopted • Measure of integration of in situ and satellite ob system
Planning Metrics • Community plans developed and reviewed describing: • Motivation • Multi-year implementation plans • Data systems and QC procedures • Community infrastructure to achieve above (e.g., WCRP, GCOS, SSCs, etc) and offer sense of prioritization? • Pathways and milestones for sustainable systems? (plans, review, etc)
SYSTEM MONITORING www.osmc.info / www/jcommops.org