Download
1 / 41
410 likes | 419 Views
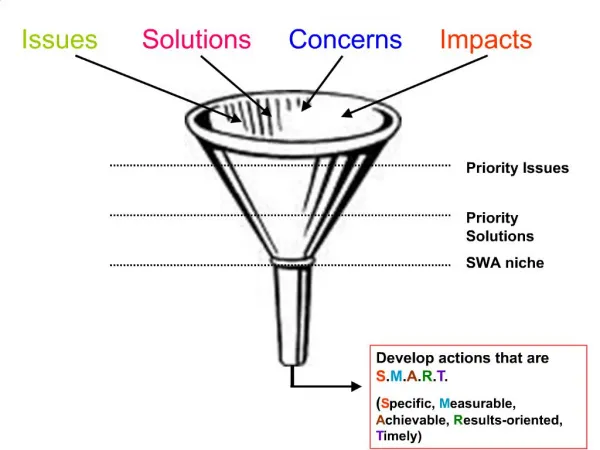
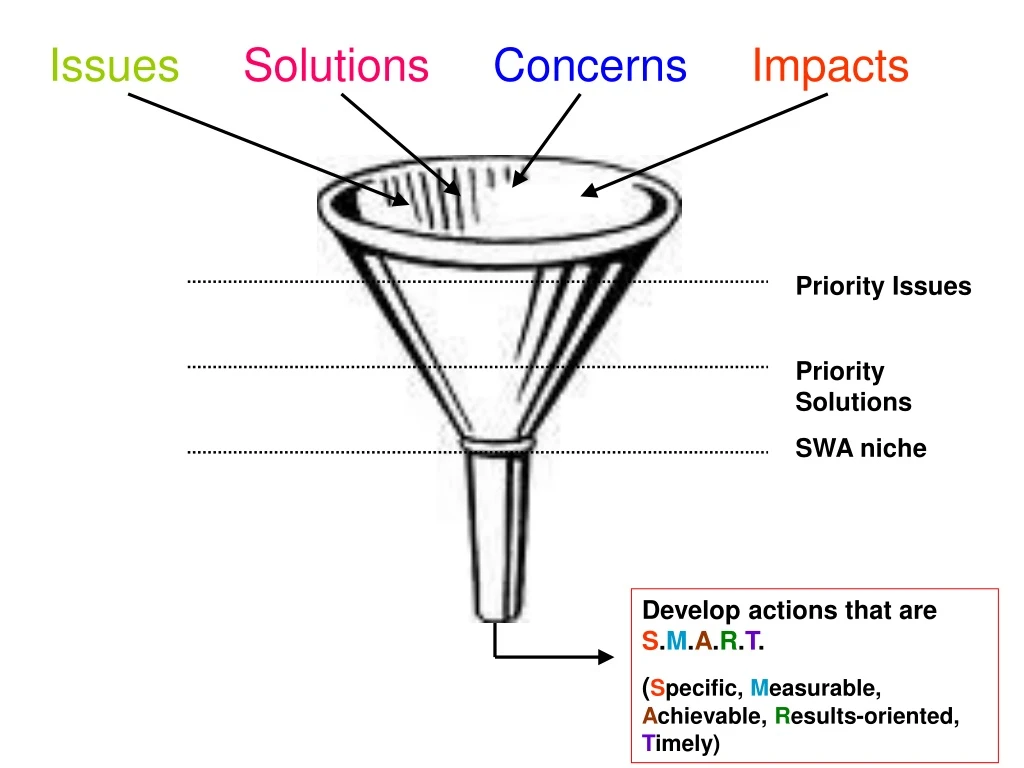
Issues Solutions Concerns Impacts. Priority Issues. Priority Solutions. SWA niche. Develop actions that are S . M . A . R . T . ( S pecific, M easurable, A chievable, R esults-oriented, T imely).

E N D
IssuesSolutions ConcernsImpacts Priority Issues Priority Solutions SWA niche Develop actions that are S.M.A.R.T. (Specific, Measurable, Achievable, Results-oriented, Timely)
Taking Action to Restore Water Quality in New Hampshire’s Coastal Region: Threats, Problems, and Solutions A Presentation to the Southeast Watershed Alliance (SWA) Prepared by the SWA Advisory Committee
Presentation Overview Part I – Regional Water Quality Problems • Water Quality Status and Trends • Regulatory Drivers Part II – Taking Action • Pollution Sources • Solutions
We live in a beautiful and healthy state #3 on 2008 list of healthiest states #2 in percent forest cover 7th lowest in per capita energy consumption New Hampshire has more than 17,000 miles of rivers and streams, over 1,000 lakes, and 294 miles of ocean and estuarine coastline.
We have major challenges ahead • Land use – sprawl • Water quality – stormwater • Habitat loss – fragmentation • Infrastructure – water and sewer systems • Climate change – precipitation and sea level These challenges all come together in our watershed.
The Physical “Piscataqua Region” • 1 Big Watershed • 11 Sub-watersheds • Covers 1,086 mi2 • 14% of NH and Maine population • Great Bay and Hampton-Seabrook Estuaries
The Political “Piscataqua Region” • 3 States • 52 Municipalities • 4 Regional Planning Commissions
The Regional Water Quality Picture Blue = Waters meet Clean Water Act Requirements Orange = Marginal Impairment Red = Severe Impairment
PREP Indicators Report • Reviewed by PREP staff and Technical Advisory Committee • Represents current scientific consensus Available at www.prep.unh.edu/resources/soe_report.htm
Dry Weather Bacteria Concentrations Have fecal coliform bacteria levels in the Great Bay Estuary changed over time? Yes. Bacteria levels in Great Bay decreased significantly in the 1990s but have not changed in the past 10 years. Water quality standards for swimming and shellfishing are not being met in all areas. Q: A:
Advisories at Tidal Bathing Beaches Data Source: NHDES Beach Program
Toxic Contaminants in Shellfish Tissue Have the concentrations of toxic contaminants in the tissues of shellfish changed over time? Yes. The concentrations of PAHs have increased by 51% in Portsmouth Harbor and by 218% in the Piscataqua River over the past 16 years. Concentrations of other contaminants are declining. Q: A:
Nitrogen in Great Bay Have nitrogen concentrations in Great Bay changed significantly over time? Yes. The total nitrogen load to the Great Bay Estuary has increased significantly. Dissolved inorganic nitrogen concentrations have increased in Great Bay by 44% in the past 28 years. Q: A:
Nitrogen Loads to the Great Bay Estuary Total N load 2002-2004 1,097 tons/yr 2006-2008 1,558 tons/yr Percent Change 42% WWTFs, 484.64 tons/yr, 31% Groundwater, 31.28 tons/yr, 2% Tributaries and Runoff, 1014.00 tons/yr, 65% Atmospheric, 27.92 tons/yr, 2% Data Source: PREP
Nitrogen, Suspended Solids, and Chlorophyll-a in Great Bay Suspended Solids 123% increase over 28 years Chlorophyll-a 28% increase over 28 years Dissolved Inorganic Nitrogen 44% increase over 28 years Dissolved Inorganic Nitrogen 44% increase over 28 years Data Source: UNH JEL
Dissolved Oxygen How often do dissolved oxygen levels in the estuary fall below state standards? Rarely in the bays and harbors but often in the tidal rivers. Q: A:
Dissolved Oxygen at Datasondes Data Source: Great Bay NERR, UNH JEL
Eelgrass Has eelgrass habitat in Great Bay changed over time? Yes. Eelgrass cover in the Great Bay has declined by 37% between 1990 and 2008 and has completely disappeared from the tidal rivers, Little Bay, and the Piscataqua River. Q: A:
Eelgrass in Great Bay in 2008 Data Source: UNH Seagrass Ecology Group
The Regional Water Quality Picture Blue = Waters meet Clean Water Act Requirements Orange = Marginal Impairment Red = Severe Impairment
Impacts on Communities • Regulatory fines for non-compliance • Drinking water threats – quantity and quality • Increased expense for drinking water treatment • Unsustainable water withdrawals • Increased flooding impacts • Toxic cyanobacteria blooms in ponds/lakes • Loss of rural aesthetics (sprawl, traffic, etc.) • Loss of wildlife habitat and diversity Preventing problems is cheaper than fixing them
Regulatory Drivers • Clean Water Act Requirements (EPA/DES) - Impairments Identified - Total Maximum Daily Loads (TMDLs) - Loading allocations - Municipal stormwater (MS4) permits - Residual Designation Authority • Instream flow regulation • Stressed subwatersheds (too many withdrawals)
Part II – Taking Action • Pollution Sources • Solutions Key Concept: Many actions we can take will address multiple pollution problems (sediments, nutrients, bacteria, etc.)
Major Causes of Water Quality Impairments Stormwater Runoff Dams/culverts Water Quality Problems Industry Agriculture Sewage Fertilizers Energy Production Transportation
Pollution Source: Stormwater Runoff Solutions: • Protect natural stream/wetland buffers • Preserve wetlands and natural areas • Minimize impervious surfaces • Stormwater retrofit projects • Effective regulatory stormwater management requirements for all new development and re-development- Low Impact Development techniques- Maximize on-site infiltration- Require water quality treatment
Pollution Source: Transportation (oils, carbon, nitrogen, road salt) Solutions: • Invest in mass transport • High efficiency/alternative vehicles • Smarter transportation planning • Stricter NOx tailpipe emissions requirements • Stormwater treatment
Pollution Source: Energy Production (burning fossil fuels) Solutions: • Transition to renewable energy • Stricter NOx emissions requirements
Pollution Source: Wastewater Treatment Plants Solutions: • Treatment plant upgrades to remove nutrients • Couple nutrient removal with commodity production (e.g. algae)
Pollution Source: Septic Systems (typically only remove ~25% of N) • Require best available technology for new or replacement systems (~50% N removal) • Larger setbacks from surface waters to let vegetated buffers take up N and bacteria
Pollution Source: Landscaping Fertilizer Solutions: • Reduce/eliminate fertilizer use • Buffers and setbacks from surface waters • Slow-release fertilizers • Minimize lawns, utilize low-N species • Rain gardens
Pollution Source: Agriculture Solutions: • Sustainable on-site fertilizer application • Minimize inorganic N fertilizer use • Proven best management practices (e.g. sediment and erosion control) • Manure containment • Buffers along waterways • Organic farming
Big Picture Solutions – Land Use is Key Population growth and increases in impervious surfaces (i.e. pavement) increase pollution
Impervious Surfaces in the Piscataqua Region Watershed 1990 28,710 acres 4.3% 2000 42,618 acres 6.3% 2005 50,351 acres 7.5% Data Source: UNH CSRC
Buffers are low cost, high-performance options for stormwater management and resource protection.
The Piscataqua Region Environmental Planning Assessment Evaluated every municipality in the region for: • Wildlife Habitat Protection • Wetland Protection • Shoreland Protection • Stormwater Management • Erosion & Sediment Control • Drinking Water Protection • Floodplain/Hazard Planning • Impervious Surface Limits • Non-Regulatory Conservation Efforts
Bottom Line: We need to improve the regional consistency and quality of local regulations – especially for stream buffers and stormwater management.
“The Alliance” Potential Tools Refer to Breakout Group Checklist…
IssuesSolutions ConcernsImpacts June 2010 Priority Issues Sep 2010 Priority Solutions Nov 2010 SWA niche Develop actions that are S.M.A.R.T. (Specific, Measurable, Achievable, Results-oriented, Timely) Dec 2010