Download
1 / 37
370 likes | 574 Views
Lessons Learned: Risk MAP Early Demonstration Project Madison County, AL . TN AFPM 2011 Montgomery Bell State Park July 28, 2011 Eric Zgonina , EIT AMEC . Map Modernization & Risk MAP Overview Risk MAP Early Demonstration Purpose Study Area Selection/Proposal

E N D
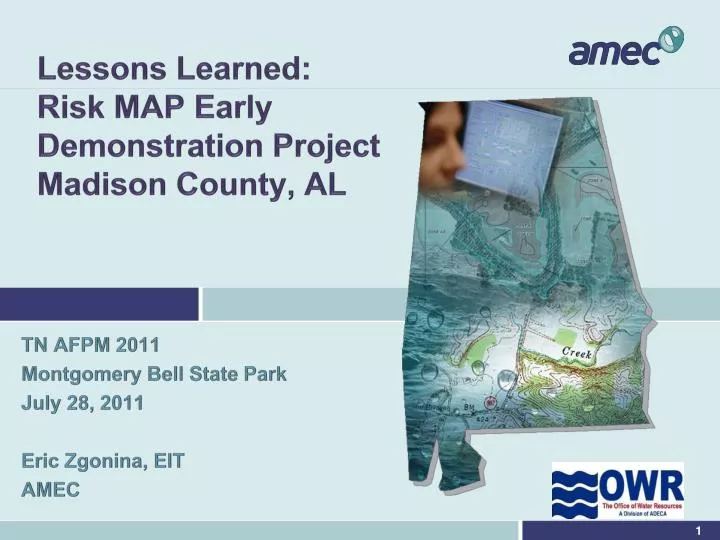
Lessons Learned: Risk MAP Early Demonstration Project Madison County, AL TN AFPM 2011 Montgomery Bell State Park July 28, 2011 Eric Zgonina, EIT AMEC
Map Modernization & Risk MAP Overview Risk MAP Early Demonstration Purpose Study Area Selection/Proposal Product Results and Findings Stakeholder Feedback Mapping Partner Recommendations Moving forward with Risk MAP Presentation Outline
FEMA Map Modernization Program • Map Mod brought NFIP mapping into 21st century • Ran from 2003-2010 • Transition from paper to digital format • Significant advantages in capability and precision • New digital SFHA’s for 92% of the population • Encourage use of quality local data
FEMA Vision for Risk MAP • FEMA Risk Mapping, Assessment, and Planning (MAP) Program • Deliver quality flood data that increases public awareness • Initiate mitigation measures to reduce risk and loss of life and property • Transform traditional flood mapping to better integrate: • Identification • Assessment • Communication • Planning for • Mitigation of flood related risks • Ensure 80% of the Nation’s flood hazards are current • Update flood hazard data for 100% of the populated coastal areas in the Nation
Risk MAP Early Demonstration Purpose Risk MAP Development • Early Demonstration Projects • Validate Risk MAP products increase value to program vision • Emphasize production efficiencies and innovations • Update Guidance • Ascertain product refinement • Determine costs • Stakeholder feedback
Early Demonstration Requirements Project study area funded prior to 2010, pre-appeal phase Strong Regional Support Efforts could not exceed $100k Good elevation data Completion by February 2011, lessons learned integrated prior to FY2011 Risk MAP
Early Demonstration Area Selection, Madison County, AL • Produce: • Changes Since Last FIRM • Flood Risk Probability Grids • Depth Grids • Flood Risk Report • Flood Risk Map • Two Stakeholder Meetings • Enhanced: • Annualized Loss Estimates • Velocity Grids • Areas of Mitigation Interest Madison County Project Effective 1998 FY2008/2009 funding Strong stakeholder relationship, OWR and AMEC Current ground surface data:LiDAR 2007 Area which will benefit from products, mitigation potential Existing county revision, several detailed studies
Changes Since Last FIRM CSLF example: Bradford Creek, Madison, AL • ESRI model builder tool developed • Data stored in Flood Risk Database • FRR shows summaries SFHAs affected • Greatest level of effort: • attributing factors contributing to the shape of the SFHA • Population and buildings affected
Areas of Mitigation Interest Channel Improvements
Areas of Mitigation Interest Flood Control Structures
Water Surface Elevation and Flood Depth Grid Initial Raster Mosaicing • By products of floodplain mapping • Mosaicingrasters can horizontally skew data • Resampling model grids can reduce the magnitude of the skew • Resulted in average horizontal skew of less than one foot
Velocity Grid Methodologies Tiling Using AFG Floodplain Using Geo-RAS Floodplain • HEC-GeoRAS and RAS Mapper methodologies were considered • HEC-GeoRAS - smoothest and most accurate velocity grid • Floodplain polygons required inputs for velocity grid creation • AFG chosen over HEC-GeoRAS
Velocity Grid Results Velocity grid example: confluence of Indian Creek Trib 1 and Indian Creek, Intersection of Slaughter Road and Interstate 565 Huntsville, AL, 100 yr event
Percent Chance of Flooding Equations 30 -Year Percent Chance 1 - (1 - p)30
Percent Chance of Flooding Methodology Procedure derived based on FEMA guidance ESRI model builder tool created Grids were created for each of the selected flooding source intervals and mosaiced by county
Percent Annual Chance and Percent 30-Year Results Aldridge Creek, near Valley Hill Country Club area, Huntsville, AL
Flood Risk Assessment • Flood Risk Assessment Products (10%, 4%, 2%, 1%, 0.2%, and annual chance) • Area (Risk, Very Low to Very High) • Classification (Residential, Commercial, Other) • Population • Average Value (buildings/census block) • Total Loss • Building Loss • Content Loss
Result Discrepancies High density in floodplain, LOW RISK? Undeveloped areas, high risk?
Locally Supplied Building Data Content value Building type Latitude/Longitude Occupancy class • Building footprints • First floor elevations • Constructions materials • Number of stories or height • Year built/age/building quality • Building value
Flood Risk Assessment Results FEMA provided a Level 1 HAZUS risk assessment for each census block. Results were poor in quality. Classified all census blocks as residential in Madison County. Community stakeholders noted areas of high risk labeled as very low risk in HAZUS. Enhanced flood risk assessment not possible with current version of HAZUS, needs to be revised.
Watershed Flood Risk Report • Provides a summary of all flood risk information in single source.
Flood Risk Map • Countywide base data • FEMA AAL • Contributing Engineering Factors • Areas of Mitigation Interest
Revised FEMA Guidance, Appendix N & O CSLF • Contributing engineering factor became a variable attributed with 12 possible fields • Ex: New Terrain Data- If new terrain data was introduced and that new data caused the floodplain boundaries to change, the attribute would be “True” • No procedure for start/end of flooding sources included. • No new field for new flood source added
Revised FEMA Guidance, Appendix N & O Flood Depth Analysis Grids • Defined naming convention and raster cell size (resolution) for all raster datasets =10 meters (32.808 feet). • If higher resolution depth or analysis rasters are produced, Mapping Partners shall submit outside of the FRD. • Section detailing combining depth grids at a confluence, acceptable depth difference (+/- 0.5 ft), engineering judgment applied when exceeds
Revised FEMA Guidance, Appendix N & O Flood Risk Assessment Guidance details MR4 version cannot calculate annualized loss but does include a HAZUS alternative loss calculation formula. Guidance does not address partial dataset information entered into the Comprehensive Data Management System (CDMS) but defers users to CDMS manual. MR5 available and new version of CDMS should be available soon AOMI’s Remains point feature Defines how to create AOMI Data including detailing the data mining process
Revised FEMA Guidance, Appendix N & O FRR Guidelines are not mandatory and some portions may be tailored by writer Template Tables may be edited based on available information Template text edited FRM Purpose of FRM is intended for facilitation purposes to involve communities Legend modified- specifies AOMIs Most recommendations followed
Moving Forward with Risk MAP Communication
Mutually Beneficial Partnerships Develop a framework that collects information on the effectiveness of partnerships Ensure Risk MAP products from partnerships are complementary and not duplicative Collaborate with partners to improve understanding and encourage action Provide support to partners to include policies, procedures, guidelines, and training
Outreach and Communications Reaching Stakeholders • Conferences • Media Relations • Community Meetings • Social Media • Facebook • Twitter • Web Applications • Phone apps • Other
Presentation Conclusions • Risk MAP Early Demonstration Project was successful • Emphasized production efficiencies and innovations • Presented product cost estimates • Provided Stakeholder feedback • Provided Mapping Partner feedback • Aided in update to guidance