Download
1 / 52
520 likes | 591 Views
Young Persons Alcohol and Tobacco Survey 2011 Lancashire Local Authority Results. Issue date: 13th July 2011. Table of contents. Introduction Sample profile Alcohol consumption Purchasing alcohol General attitudes and behaviour Understanding of legislation Smoking behaviour.

E N D
Young Persons Alcohol and Tobacco Survey 2011Lancashire Local Authority Results Issue date: 13th July 2011
Table of contents • Introduction • Sample profile • Alcohol consumption • Purchasing alcohol • General attitudes and behaviour • Understanding of legislation • Smoking behaviour
Background and objectives • In 2011, Ci Research (Ci) was re-commissioned by Trading Standards North West (TSNW) to conduct a regional study to monitor and evaluate the behaviour and attitudes of 14-17 year olds towards alcohol and tobacco. • This study has been conducted every two years since 2005 and covers the majority of local authorities in the North West region. • The findings of the study are used to: • Inform strategies for dealing with the sale of alcohol and tobacco to young people who are under age; • Monitor changes in behaviour and attitudes regarding alcohol consumption; • Identify key areas to focus efforts in addressing issues related to the sale of alcohol and tobacco to those who are underage. • This report details the latest results for Lancashire Local Authority, highlighting the changes in attitudes and behaviour over time, significant differences by age and gender, and comparisons with other local authorities.
Methodology overview • Fieldwork took place between January and April 2011. • The self-completion questionnaire used for the latest survey was similar to the one used in 2009, to enable comparisons of the results against previous studies. • 21 Trading Standards Servicesin the North West participated in the 2011 survey. • Individual Trading Standards Services assumed responsibility for the distribution and collection of questionnaires to and from schools. • Local Trading Standards Services liaised with local schools to obtain survey responses. • The survey highlighted that pupils should be open and honest when completing the questionnaires, and assured that all responses would be anonymous. • A total of 13,051 questionnaires were completed and returned to Ci. Of these, 1461 (11%) were from young people in schools in the Lancashire Local Authority • Ci assumed responsibility for collating and verifying all the data and information provided, and producing report summarising the key research findings. • Separate local authority area reports are also being produced to inform local understanding and initiatives.
1461 young people from Lancashire took part in the 2011 survey, ensuring that overall results for the local authority were accurate to between +/-1.54% to +/-2.56%, based on a 95% confidence level. Sample breakdown by Local Authority Number of Respondents Number of Respondents Base: In brackets - see legend
The map below provides a geographical illustration of who took part in the survey in Lancashire. Over two thirds (69%) of respondents provided a postcode, of which 76% could be matched for mapping purposes. 31% of the sample in Lancashire did not disclose their postcode. Base: 768 Respondents (53% of sample) Balance: 94 Respondents (6% of sample) –Only provided postcode for first 2-3 characters 148 Respondents (10% of sample) –Provided 4+ characters, but postcode could not be identified 451 Respondents (31% of sample) –Did not enter a postcode
The majority of the sample still falls under the Greater Manchester Police Authority, despite the proportion declining since 2005. Compared to the 2009 survey there is slightly higher representation from Merseyside, Cheshire and Cumbria. Sample breakdown by Police Authority % Respondents Base: 2005 - 12840 ; 2007 - 11724; 2009 – 13902; 2011 - 13051
In Lancashire, there was a near equal split in the proportion of males and females who took part in the survey. As in previous years, the sample comprised predominantly of 15 and 16 year olds, although there was a significant decrease in the proportion of 16 year olds (36% cf. 55% in 2009) and a higher representation from 14 year olds than previously seen (10%). Sample breakdown by Gender Lancashire Sample breakdown by Age Lancashire NW Total Sample 2011 14 Year olds: 13% 15 Year olds: 46% 16 Year olds: 39% 17 Year olds: 1% % Respondents % Respondents NW Total Sample 2011 Male 50% Female 50% Base: 2005 – 729; 2007 – 769; 2009 – 1558; 2011- 1373 Balance: Not stated Base: 2005 - 715; 2007 – 769; 2009 – 1558; 2011- 1328 Balance: Not stated
The table below provides an estimate of the statistical accuracy of results for Lancashire based on the samples achieved, and assuming 95% confidence levels. These figures will differ from question to question as not all respondents answered every question. Sample Confidence Intervals - Lancashire
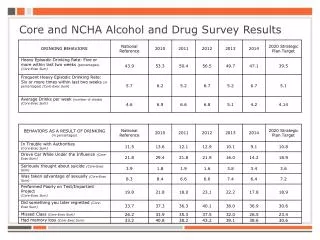
The proportion of 14-17 year olds claiming to drink alcohol once a week or more has continued to decline (31% cf. 40% in 2009). This is marginally higher than the regional average (+2%). How often do you drink alcohol? (prompted) Lancashire NW Total Sample 2011 Once a week or more: 29% Less than once a week: 51% Never: 20% % Respondents Base: 2005 - 693; 2007 – 971; 2009 – 1618; 2011- 1449 Balance: Not stated
Analysis at a more detailed level reveals a 4% fall in the proportion of 14-17 year olds in Lancashire who claimed to drink alcohol twice a week or more (17% cf. 21% in 2009). “How often do you drink alcohol” findings available at a more detailed level from 2007 onwards only. Not available to this level for 2005. How often do you drink alcohol? (prompted) Lancashire NW Total Sample 2011 Twice a week or more: 14% Once a week: 15% 1 to 3 times a month: 25% Less than once a month: 26% Never: 20% % Respondents Base: 2007 – 791; 2009 – 1618; 2011- 1499 Balance: Not stated
Young people in Oldham and Trafford have the highest proportion drinking at least once a week (both 40%). Lancashire has a slightly higher proportion of 14-17 year olds drinking alcohol at least once a week (32%) compared to the North West overall (29%). How often do you drink alcohol? (Analysis by Local Authority) Overall NW 2011 % Respondents Base: 12,964 Balance: Not stated
Results indicate that alcohol consumption amongst males in Lancashire is more polarised, with slightly higher percentages claiming not to drink and drink alcohol frequently compared to females. The chart also highlights that the likelihood to drink alcohol increases with age. How often do you drink alcohol? (Analysis by age and gender) Lancashire: 2011 % Respondents Base: In brackets Balance: Not stated. *N.B. Low sample size
The percentage of 14-17 year olds in Lancashire identified as binge drinkers has fallen in 2011 (65%, cf. 71% in 2009). Frequency of binge drinking (5 or more alcoholic drinks on one occasion) Lancashire NW Total Sample 2011 Never binge drink: 33% Occasional binge drinkers:47% Regular binge drinkers: 20% % Respondents Base: 2007 – 780; 2009 – 1602; 2011- 1437 Balance: Not stated. Not asked in 2005
Analysis at a more detailed level reveals a 10% fall in the proportion of 14-17 year olds in Lancashire that claimed to binge drink at least once a week (20% cf. 30% in 2009). Furthermore those claiming to never binge drink has increased (35% cf. 29% in 2009). Frequency of binge drinking (5 or more alcoholic drinks on one occasion) Lancashire % Respondents NW Total Sample 2011 Twice a week or more: 10% Once a week: 10% 1 to 3 times a month: 19% Less than once a month: 28% Never: 13% Never drink: 20% Base:2007 – 780; 2009 – 1602; 2011- 1449 Balance: Not stated. Not asked in 2005
Relatively higher levels of regular binge drinking were identified amongst 14-17 year olds in Rochdale (31%), Oldham (25%), Blackburn and Trafford (both 23%). The results for Lancashire were consistent with the North West average. Frequency of binge drinking (Analysis by Local Authority) 2011 % Respondents Base: 10,188 Balance: Not stated
Within Lancashire, binge drinking (both occasional and regular) increases with slightly age. Males were found to be more polarised in their behaviour with regards to binge drinking, with a slightly higher proportion both regularly and never binge drinking compared to females. Frequency of binge drinking (Analysis by age and gender) Lancashire: 2011 % Respondents Base: see brackets Balance: Not stated. *N.B. Low sample size
The proportion of 14-17 year olds claiming to drink alcohol on their own was slightly higher than recorded previously, and in line with the regional average. Males were more likely to drink on their own (9%) than females (5%). Do you tend to drink alone or in groups? (% who drink alone) Lancashire NW Total Sample 2011 Drink alone: 7% % Respondents who drink alone Base: 2007 – 680; 2009 – 1251; 2011- 1084 Balance: Not stated / Do not drink alcohol. Not asked in 2005
It is noted that there has been a decrease in the percentage of 14-17 year olds in Lancashire who claimed to drink alcohol outside (22% cf. 34% in 2009) and in pubs or clubs (20% cf. 32% in 2009). Where do you mostly drink? (prompted) Lancashire % Respondents NW Total Sample 2011 Special occasions (friends): 49% Friend’s house (parents out); 49% Special occasions (family): 47% At home (parents in): 49% Friend’s house (parents in):40% Outside: 21% Pubs / clubs: 20% At home (parents out): 24% Base: 2007 – 697; 2009 – 1308; 2011- 1145 Balance: Not stated. Do not drink alcohol. Multiple responses allowed.
Underage drinking in pubs / clubs appears to be more prevalent in Rochdale, Blackburn and Bury. Drinking outside in parks and the streets appears to be more of an issue in Oldham, Blackburn, Manchester, Liverpool and Trafford. Lancashire’s results are relatively consistent with the North West region as a whole. Percentage drinking outside / in pubs or clubs - Analysis by Local Authority 2011 % Respondents Base: 10,254 Balance: Not stated
Where 14-17 year old did drink outside, approaching two fifths (38%) claimed to do so in groups of more than 10, 5% higher than in 2009 (33%), but slightly below the North West average (40%). If you drink outside, approximately how many other people do you usually drink with? Lancashire NW Total Sample 2011 1 to 2: 2% 3 to 5: 19% 6 to 10: 39% 11 to 20: 28% More than 20:12% % Respondents Base: 2007 – 261; 2009 – 451; 2011- 222 Balance: Do not drink alcohol outside. Not stated. Not asked in 2005
28% of 14-17 year olds in Lancashire claimed to drink 5 or less units of alcohol per week (2% higher than the regional average). There has been a 10% decline in the proportion claiming to drink more than 30 units a week (8% cf. 18%). In a typical week, how many units of alcohol do you drink? Lancashire % Respondents NW Total Sample 2011 5 or less: 26% 6 to 10:20 % 11 to 15: 15% 16 to 20: 10% 21 to 25: 7% 26 to 30: 5% More than 30: 9% Base: 2007 – 470; 2009 – 884; 2011- 701 Balance: Do not drink alcohol. Not stated. Not asked in 2005.
WKD and Smirnoff were identified as the most popular brands amongst 14-17 year olds in Lancashire, although the popularity of both has declined since 2009.This is consistent with the North West overall. Preferred brands Lancashire % Respondents NW Total Sample 2011 Top 10 Smirnoff / Ice: 9% WKD: 6% Fosters: 4% Budweiser: 4% Magners: 3% Strongbow: 3% Corona: 2% Stella: 2% Carlsberg:2% Jack Daniels: 2% Base: 2007 – 384; 2009 – 700; 2011- 1164 Balance: Do not drink alcohol. Not stated Not asked in 2005. Multiple response allowed
In line with the North West results, most 14-17 year olds in Lancashire claimed to get alcohol from their friends and family. Results for Lancashire showed that the proportion who claimed to purchase their own alcohol has fallen. This was particularly notable in pubs/ clubs (down to 9% from 18% in 2009). Where do you get your alcohol from? Lancashire % Respondents NW Total Sample 2011 Friends / family over 18: 52% Parents / guardians: 55% Buy from off licences: 12% Friends / family under 18:15% Buy from pubs / nightclubs: 11% Adults outside shops buy: 11% Take from parents: 8% Buy from supermarkets: 4% Base: 2007 – 691; 2009 – 1283; 2011- 1117 Balance: Do not drink alcohol. Not stated Multiple response allowed
The percentage of 14-17 year olds in Lancashire who claimed to buy alcohol themselves has fallen by 12% (15% cf. 27% in 2009). Percentage claiming to buy themselves Lancashire % Respondents Lancashire Base: 2005 – 615; 2007 – 691; 2009 – 1283; 2011- 1117 Balance: Do not drink alcohol. Not stated
The percentage of 14-17 year olds claiming to buy alcohol themselves has remained consistent or fallen for most local authorities. Lancashire had one of the lowest percentages for 14-17 year olds purchasing alcohol themselves (15%), 5% below the regional average (20%). Percentage buying alcohol themselves - Analysis by Local Authority % Respondents Base: 2007 – 9410; 2009 – 10,802; 2011 – 10,004 Balance: Not stated
In Lancashire, the percentage of 14-17 years olds buying alcohol themselves has declined by 12% (15% cf. 27% in 2009). This fall is consistent by gender and across all ages groups. Percentage buying alcohol themselves - Analysis by age and gender Lancashire NW Total Sample 2011 20% % Respondents Overall Base: 2007 – 691; 2009 – 1283; 2011- 1117 Balance: Do not drink alcohol / Not stated Results not shown where base size is <10.
Approximately half (51%) of the 14-17 year olds surveyed in Lancashire who claimed to purchase their own alcohol stated that they had been asked for ID. There was no significant difference in the results by age or gender. Have you ever been asked for ID when buying alcohol? (% answering yes) Lancashire NW Overall Sample 2011 Yes: 52% % Respondents saying “yes” Base: 2007 – 236; 2009 – 339; 2011- 169 Balance: Have not bought alcohol themselves. Not stated. Results not given where base size is <10 Not asked in 2005
In this latest survey, 8% of 14-17 year olds in Lancashire claimed to have fake ID. Buying from the internet remains the most common means of obtaining fake ID, although there appears to have been a sharp rise in the percentage making fake ID themselves (30% cf. 10% in 2009). Do you have fake ID? Lancashire Where did you get your fake ID from? Lancashire % Respondents % Respondents NW Total Sample 2011 Yes: 7% No: 93% NW Total Sample 2011 Internet: 31% Made myself: 29% Friend/family O18: 6% Older sibling: 22% Friend/family U18:4% Base: 2007 – 680; 2009 – 1163; 2011- 1112 Balance: Not stated. Not asked in 2005 Base: 2007 – 37; 2009 – 94; 2011- 82 Balance: Do not have fake ID, Other, Not stated Not asked in 2005
Attitudes and behaviour remained relatively consistent in 2011. However, there was a notable decline in the proportion claiming to drink alcohol just to get drunk (52% cf. 61% in 2009). Attitudes and behaviour relating to alcohol Lancashire 2011 Differences % Disagree Strongly / Disagree % Agree Strongly / Agree NW Total 2011 87% 92% Female 79% Male I make sure I am not on my own when out drinking alcohol (1083) I drink alcohol to get drunk* (1100) 59% 66% Male 54% Female I always feel in control when I drink (1093) 58% 48% Female 37% Male I tend to forget things when I have been drinking (1084) 42% I drink alcohol because my friends do (1107) 27% I drink alcohol because there is nothing else to do (1098) 22% 32% Female 14% Male I worry that my drink may get spiked (1090) 26% Base: 2007 – 684 (Avg); 2009, 2011 – See brackets above Balance: Not stated / Do not drink. Not asked in 2005. *Not asked in 2007
Compared to 2009, a lower percentage of 14-17 year olds in Lancashire claimed to have had sex, and a lower percentage claimed to have been violent of had a fight whilst drunk. Behaviour relating to alcohol Lancashire % saying ‘yes’ NW Total 2011 (% yes) 32% 22% 13% 15% 2011 Differences % saying ‘no’ Have you ever had sex?* (1031) 40% 16yrs old 30% 15yrs old Have you ever been violent or had a fight whilst drunk? (1071) 31% Male 19% Female Have you ever been in a car with a young person driving who had been drinking? (1108) Have you ever regretted having sex after drinking? (679) Base: 2007 – 673 (Avg); 2009, 2011 – See brackets above Balance: Not stated / Do not drink. Not asked in 2005 *Not asked in 2007
In Lancashire, understanding of legislation with regard to alcohol was slightly higher than for previous years. Understanding of legislation regarding alcohol Lancashire % thinking statement is “False” % thinking statement is “True” NW Total 2011 It is a criminal offence for U18s to drink alcohol at home (1340) 10% It is a criminal offence for O18s to buy alcohol for U18s (1339) 82% It is a criminal offence for U18s to buy alcohol (1360) 91% It is a criminal offence to sell alcohol to U18s (1341) 93% Base: 2007 – 762 (Avg); 2009, 2011 – see brackets above Balance: Not stated.
Thinking specifically about understanding of legislation around under 18s purchasing alcohol, 14-17 year olds surveyed in Lancashire who claimed to buy their own alcohol were less likely to be aware that this is an offence compared to others. Understanding of legislation:It is a criminal offence for under 18s to buy alcohol? (Analysis by purchasing behaviour) - Lancashire 2011 % Respondents Base: In brackets Balance: Not stated
A fifth of 14-17 year olds (20%) surveyed in Lancashire claimed to smoke, 4% lower that the figure reported in 2009 (24%). The percentage who claimed to have never tried smoking was 6% higher than in 2009 (51% cf. 45%). Which of the following best describes your smoking behaviour? (Prompted) Lancashire NON-SMOKERS 2011: 80% 2009: 76% 2007: 72% NW Total Sample 2011 Never tried: 54% Tried but did not like: 22% Smoked but given up: 6% Smoke when drinking alcohol:7% Smoke less than 5 a day: 3% Smoke 6-10 a day: 4% Smoke >10 a day: 4% SMOKERS 2011: 20% 2009: 24% 2007: 27% % Respondents Base: 2007 – 779; 2009 – 1579; 2011- 1391 Balance: Not stated Not asked in 2005
In 2011, none of the North West local authorities reported an increase in the percentage of smokers amongst 14-17 year olds. The percentage claiming to smoke in Lancashire was slightly higher than for the North West overall. Do you smoke? (Analysis by Local Authority) % Respondents Base: 2009 – 13038; 2011 – 12,388 Balance: Not stated
An analysis of the results by segment highlights that young females in Lancashire were more likely to smoke than young males. The percentage claiming to smoke increased with age. Do you smoke? (Analysis by age and gender) Lancashire 2011 % Respondents Base: In brackets Balance: Not stated. N.B.* Low sample size
The majority of young smokers in Lancashire claimed to have started smoking when they were aged 13 to 14 (41%). Results show an increase in the percentage who claimed to start smoking at the age of 10 or less (15% cf. 11% in 2009). How old were you when you started smoking? Lancashire % Respondents NW Total Sample 2011 10 or less: 13% 11 years old: 8% 12 years old: 13% 13 years old: 22% 14 years old: 24% 15 years old: 17% 16 to 17 years old: 2% Base: 2007 – 779; 2009 – 434; 2011- 315 Balance: Not stated / Do not smoke Not asked in 2005
There has been a sharp fall in the proportion of young smokers in Lancashire claiming to purchase their cigarettes from off licences (30% cf. 42% in 2009) and newsagents (24% cf. 37% in 2009). Where do / did you get your cigarettes from? Lancashire % Respondents NW Total Sample 2011 Buy from off licences: 34% Buy from newsagents: 27% Brothers /sisters / friends (>16/18): 31% Brothers / sisters / friends (<16/18): 25% Buy from street sellers / neighbours / vans:18% Parents / guardians; 13% Buy from supermarkets: 8% Buy from vending machines: 8% Base: 2007 – 275; 2009 – 472; 2011- 331 Balance: Not stated / Do not smoke. Multiple responses allowed. Not asked in 2005.
In particular, 14 year olds appear to be more likely than other age groups to from brothers, sisters and friends under 18 and informal sellers. These results, however, should be treated with caution owing to the low sample size. Where do / did you get your cigarettes from? (By Age) Lancashire 2011 Base: In brackets Balance: Not stated / Do not smoke# Results not shown where sample size is <10 % Respondents
Latest results indicate that there has been a significant fall in the purchase of single cigarettes, cigarettes with health warnings in different languages and fake cigarettes amongst 14-17 year olds in Lancashire. Have you ever bought…? Lancashire NW Total Sample 2011 Single Cigarettes:67% Cigarettes with health warnings in different languages: 50% Cigarettes from other sellers: 42% Fake cigarettes: 28% % Respondents Base: 2007 – 211; 2009 – 208; 2011- 163 Balance: Not stated. Do not smoke. Multiple responses allowed. Not asked in 2005
Respondents were most likely to have purchased cigarettes with health warnings in different languages in Trafford, Liverpool and Rochdale (although the sample sizes for the latter two LAs are low so the results should be treated with caution). In Lancashire, results were close to the regional average (53% cf. 50%). Have you ever bought…cigarettes with health warnings in a different language? (Analysis by Local Authority) 2011 % Respondents Base: 1,317 *N.B. Low sample size – Cheshire East, Manchester, Liverpool and Rochdale Balance: Not stated
The purchasing of fake cigarettes appeared to be most prominent in Liverpool*, Knowsley and Bolton, and least prominent in Trafford and Salford. Results for Lancashire were 6% below the North West average. Have you ever bought…fake cigarettes?(Analysis by Local Authority) 2011 % Respondents Base: 1,317 *N.B. Low Base – Cheshire East, Manchester, Liverpool and Rochdale Balance: Not stated