Download
1 / 115
1.15k likes | 1.16k Views
Tutorial on Parallel Debuggers. Shirley Browne browne@cs.utk.edu University of Tennessee/ Innovative Computing Laboratory http://icl.cs.utk.edu/ ARL MSRC Programming Tools PET http://www.arl.hpc.mil/. Debuggers Available for MSRC Platforms.

E N D
Tutorial on Parallel Debuggers Shirley Browne browne@cs.utk.edu University of Tennessee/ Innovative Computing Laboratory http://icl.cs.utk.edu/ ARL MSRC Programming Tools PET http://www.arl.hpc.mil/
Debuggers Available for MSRC Platforms • Etnus TotalView - Origin 2000, IBM SP,Sun E10000 • Cray TotalView - Cray T3E • SGI dbx, cvd - Origin 2000 • IBM pdbx, pedb - IBM SP • Sun Prism - Sun E10000 • For more information: • http://www.arl.hpc.mil/RIB/repositories/PRG/catalog/ • http://www.nhse.org/rib/repositories/cewes_spp_tools/catalog/
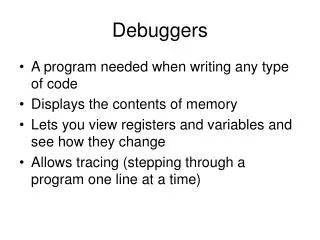
Etnus TotalView Features • Graphical user interface • Handles multiprocess multithreaded programs • Remote and distributed debugging (homogeneous platforms only) • Automatic process acquisition for MPI, PVM, PGI HPF, IBM PE • Capability of attaching to running processes • Can debug code not compiled with -g (but with reduced capabilities)
Etnus TotalView Features (cont.) • Load and examine core files • Breakpoints and evaluation points • Examine and change data • Signal handling • Message state display (new in version 3.8) • No command-line interface • Selected as the DOE ASCI debugger
Special Features for Multiprocess Programs • Separate window for each process • Sharing of breakpoints among processes • Control of process groups for SPMD or MPMD programs • Multiprocess barrier breakpoints • Single-stepping of process groups • Handles multiple symbol tables if more than one executable
Starting TotalView % totalview [filename [corefile]] [options]
Starting TotalView (cont.) • To start an SGI MPI program under TotalView: %totalview mpirun -a <mpirun command line> • TotalView starts up and shows you the code for mpirun. You should let the program run by using the Go Process (g) command. • mpirun executes and starts the MPI processes. TotalView acquires them and asks if you want to stop them at startup.
Loading Executables • If you did not lead an executable when starting TotalView, you can load one using the New Program Window (n) command, which causes a dialog box to appear into which you can enter the name of executable. • If you use the New Program Window command to load the same executable again, TotalView does not reread the executable but reuses the existing symbol table. To make TotalView reread the executable, use the Reload Executable File command.
Reloading a Recompiled Executable • To reload an updated program without existing from Totalview: • Confirm that the current process has exited. If it has not, display the Arguments/Create/Signal submenu from the process window and select Delete Program (^Z). • Confirm that duplicate copies of the process do not exist by using the ps command. If duplicate processes exist, delete them using the kill command.
Reloading (cont.) • Recompile your program. • Display the Arguments/Create/Signal submenu from the process window and select the Reload Executable File command. • TotalView updates the process window with the new source file and loads a new executable file.
Attaching to Processes • You can attach to single processes, multiprocess programs, and remote processes. • To attach to a process, use either the Show All Unattached Processes (N) or New Program Window (n) commands.
Attaching Using Show All Unattached Processes • The unattached process window lists the process ID, status, and name of each process associated with your username. The processes that appear dimmed are already attached to the debugger. • Dive (right mouse button) into the process you wish to debug. A process window appears, with the right arrow pointing to the current program counter (PC).
Attaching to an SGI MPI job • To attach to a running SGI MPI job, you should attach to the mpirun process that started the job. • TotalView attaches to the mpirun process and asks if you wish to attach to the slave MPI processes. If you select Yes, TotalView acquires all the MPI processes.
Detaching from Processes • You can detach from any processes to which you have attached. • If you want to send the process a signal, select the Set Continuation Signal command from the process window menu and choose the signal that TotalView should send to the process when it detaches from it. For example, to detach from a process and leave it stopped, set the continuation signal to SIGSTOP. • Display the Arguments/Create/Signal menu from the process window and select Detach from Process.
Handling Signals • If your program contains a signal handler, you may need to adjust the default way TotalView handles signals. To do so, display the Arguments/Create/Signal menu from the process window and select Set Signal Handling Mode.
Dialog Box for Set Signal Handling Mode Command Note: The set of signal names and numbers shown in this dialog box are platform-specific.
Setting Search Paths • If you source code and executable files reside in a number of different directories, you can set search paths for those directories using the Set Search Directory (d) command. • By default, TotalView searches the following directories in order: 1. The current working directory (.) 2. The directories you specify with the Set Search Directory command, in the order you enter them in the dialog box. 3. If you specified a full pathname for the executable when you started TotalView, the directory specified. 4. The directories specified in your PATH environment variable.
Process/thread States • Process and thread states are displayed in: • the root window, for processes and threads • the unattached processes window, for processes • the process and thread status bars of the process window, for processes and threads • the thread list pane of the process window, for threads
Process Window Details • Stack trace pane • Stack frame pane • Source code pane • Thread list pane • Action points pane
Thread list pane • Shows list of threads that currently exist in the process • Selecting a different thread (left mouse button) causes TotalView to update the stack trace pend, stack frame pane, and source code pane to show information for that thread. • Diving on a different thread (right mouse button) opens a new window displaying information for that thread. • Shift-Dive opens a new process window focused on that thread.
Thread IDs • Thread ID in root window and thread list pane is in the format tid/systid. • tid is the TotalView-assigned logical thread ID • systid is the system-assigned thread id • In other windows, TotalView uses the format pid.tid to identify threads within a process.
Stack trace pane • Shows call stack of routines executed by the selected thread • Move up and down call stack by selecting desired routine (i.e., stack frame) • Selecting a different stack frame causes TotalView to update the stack frame pane and source code pane to show information for the selected routine.
Stack frame pane • Display function parameters, local variables, and registers for the selected stack frame • Information in stack trace and stack frame panes reflects the state of the process when it was last stopped.
Source code pane • Shows source code for selected thread • Tag field to left contains line numbers. • Set breakpoint at any line that generated object code, indicated by boxed line number. • Arrow in Tag field indicates current location of program counter (PC) for selected thread. • Display source code for a given file or function by using the Function or File (f) command. • Return to executing line of code for current stack frame by using Current Stackframe (c) command.
Action points pane • The action points pane shows the list of breakpoints and evaluation points for the process. • If you dive (right mouse button) into an action point in the list, TotalView displays the line of source code containing the action point in the Source code pane.
Process/thread Navigation • Only one process window is open initally. • Selecting a process in the Root Window causes TotalView to find a process window for that process, or replace the contents of an existing process window with information for the selected process. • Diving on a process in the root window causes TotalView to find or open a new process window for that process.
Process/thread Navigation (cont.) • Shift-Dive forces TotalView to open a new process window for the dived-on process. • Use navigation buttons in upper corner of process window to move up and down the process or thread list, or to go back to the previous contents of the process window. • Whenever the process and/or thread is replaced in a process window, the previous contents are pushed onto a stack. Use the Go Back button to pop the stack.
Process/Thread Handling • thread - task with an execution context • process - address space or computer memory capable of running one or more threads TotalView support for processes and threads is operating system dependent.
OS-dependent Characteristics of Process/Thread Control • Synchronous vs. asynchronous stop • synchronous -- when one thread stops, they all stop. • Asynchronous -- only the thread that encounters the stop condition stops. • Synchronous vs. asynchronous run • synchronous -- when one thread runs, they all must run. • Asynchronous -- only the thread that wants to run need run.
OS-dependent Characteristics (cont.) • Atomic run - some OS’s allow the debugger to atomically continue a set of threads in a single operation. • Read/write while running - some OS’s allow the debugger to read from (and possibly write to) a process while one or more threads are running. • Multithreaded signal delivery - some OS’s allow the debugger to continue individual threads with their own signal values.
Process Groups • When you debug a multiprocess program, TotalView places processes in process groups. • Types of process groups:
Process Groups (cont.) • The parent process is named after the source program. • Child processes that were forked have the same name as the parent, but with a numerical suffix (.n). • Child processes that call execve() after they were forked have the parent’s name, the name of the new executable in angle brackets, and a numerical suffix.
Process Groups Window Single Process Group Window
Starting Processes and Threads • The following commands are available from a process window: • Go Process (g) creates and starts this process. Resumes execution if the process is not being held and is stopped or at a breakpoint. Starting a process causes all threads in the process to resume execution.
Starting Processes and Threads (cont.) • Go Group (G) creates and starts this process and all other proesses in the program group. Resumes execution and the execution of all process in the program group if the process is not being held and is stopped or at a breakpoint. Issuing Go Group on a process that is already running starts the other members of the program group.
Starting Processes and Threads (cont.) • Go Thread (^G) starts this thread. Disabled if asynchronous run is not available.
Single Step Commands • TotalView supports single stepping commands that allow you to do the following: • Execute one source line or machine instruction at a time. • Step over or into function calls. • Run to a selected line that is a temporary breakpoint. • Run until a function call returns.
Single Step Commands (cont.) • To cancel a single step in progress, position the mouse pointer in the process window and press CTRL-C.