Download
1 / 1
10 likes | 154 Views
wait. END. START. Molecule File. Molecule File. Draw Reentrant surfaces between nearest neighbors. Draw Reentrant surfaces between nearest neighbors. GPU. CPU. Draw Residues. Draw Residues. Define Residues. Define Residues. Voronoi Diagram.

E N D
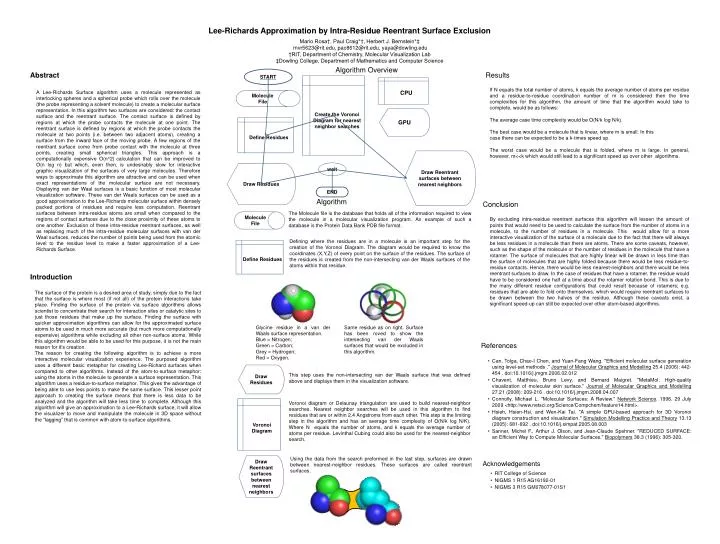
wait END START Molecule File Molecule File Draw Reentrant surfaces between nearest neighbors Draw Reentrant surfaces between nearest neighbors GPU CPU Draw Residues Draw Residues Define Residues Define Residues Voronoi Diagram Create the Voronoi Diagram for nearest neighbor searches Lee-Richards Approximation by Intra-Residue Reentrant Surface Exclusion Mario Rosa†, Paul Craig*†, Herbert J. Bernstein*‡ mvr5623@rit.edu, pac8612@rit.edu, yaya@dowling.edu†RIT, Department of Chemistry, Molecular Visualization Lab‡Dowling College, Department of Mathematics and Computer Science Algorithm Overview Abstract Results If N equals the total number of atoms, k equals the average number of atoms per residue and a residue-to-residue coordination number of m is considered then the time complexities for this algorithm, the amount of time that the algorithm would take to complete, would be as follows: The average case time complexity would be O(N/k log N/k). The best case would be a molecule that is linear, where m is small. In this case there can be expected to be a k-times speed up. The worst case would be a molecule that is folded, where m is large. In general, however, m<<k which would still lead to a significant speed up over other algorithms. A Lee-Richards Surface algorithm uses a molecule represented as interlocking spheres and a spherical probe which rolls over the molecule (the probe representing a solvent molecule) to create a molecular surface representation. In this algorithm two surfaces are considered: the contact surface and the reentrant surface. The contact surface is defined by regions at which the probe contacts the molecule at one point. The reentrant surface is defined by regions at which the probe contacts the molecule at two points (i.e. between two adjacent atoms), creating a surface from the inward face of the moving probe. A few regions of the reentrant surface come from probe contact with the molecule at three points, creating small spherical triangles. This approach is a computationally expensive O(n^2)calculation that can be improved to O(n log n) but which, even then, is undesirably slow for interactive graphic visualization of the surfaces of very large molecules. Therefore ways to approximate this algorithm are attractive and can be used when exact representations of the molecular surface are not necessary. Displaying van der Waal surfaces is a basic function of most molecular visualization software. These van der Waals surfaces can be used as a good approximation to the Lee-Richards molecular surface within densely packed portions of residues and require less computation. Reentrant surfaces between intra-residue atoms are small when compared to the regions of contact surfaces due to the close proximity of these atoms to one another. Exclusion of these intra-residue reentrant surfaces, as well as replacing much of the intra-residue molecular surfaces with van der Waal surfaces, reduces the number of points being used from the atomic level to the residue level to make a faster approximation of a Lee-Richards Surface. Algorithm Conclusion The Molecule file is the database that holds all of the information required to view the molecule in a molecular visualization program. An example of such a database is the Protein Data Bank PDB file format. By excluding intra-residue reentrant surfaces this algorithm will lessen the amount of points that would need to be used to calculate the surface from the number of atoms in a molecule, to the number of residues in a molecule. This would allow for a more interactive visualization of the surface of a molecule due to the fact that there will always be less residues in a molecule than there are atoms. There are some caveats, however, such as the shape of the molecule or the number of residues in the molecule that have a rotamer. The surface of molecules that are highly linear will be drawn in less time than the surface of molecules that are highly folded because there would be less residue-to-residue contacts. Hence, there would be less nearest-neighbors and there would be less reentrant surfaces to draw. In the case of residues that have a rotamer, the residue would have to be considered one half at a time about the rotamer rotation bond. This is due to the many different residue configurations that could result because of rotamers; e.g. residues that are able to fold onto themselves, which would require reentrant surfaces to be drawn between the two halves of the residue. Although these caveats exist, a significant speed-up can still be expected over other atom-based algorithms. Defining where the residues are in a molecule is an important step for the creation of the Voronoi Diagram. The diagram would be required to know the coordinates (X,Y,Z) of every point on the surface of the residues. The surface of the residues is created from the non-intersecting van der Waals surfaces of the atoms within that residue. Introduction The surface of the protein is a desired area of study, simply due to the fact that the surface is where most (if not all) of the protein interactions take place. Finding the surface of the protein via surface algorithms allows scientist to concentrate their search for interaction sites or catalytic sites to just those residues that make up the surface. Finding the surface with quicker approximation algorithms can allow for the approximated surface atoms to be used in much more accurate (but much more computationally expensive) algorithms while excluding all other non-surface atoms. While this algorithm would be able to be used for this purpose, it is not the main reason for it’s creation. The reason for creating the following algorithm is to achieve a more interactive molecular visualization experience. The purposed algorithm uses a different basic metaphor for creating Lee-Richard surfaces when compared to other algorithms. Instead of the atom-to-surface metaphor: using the atoms in the molecule to generate a surface representation. This algorithm uses a residue-to-surface metaphor. This gives the advantage of being able to use less points to make the same surface. This lesser point approach to creating the surface means that there is less data to be analyzed and the algorithm will take less time to complete. Although this algorithm will give an approximation to a Lee-Richards surface, it will allow the visualizer to move and manipulate the molecule in 3D space without the “lagging” that is common with atom-to-surface algorithms. Glycine residue in a van der Waals surface representation. Blue = Nitrogen; Green = Carbon; Grey = Hydrogen; Red = Oxygen. Same residue as on right. Surface has been roved to show the intersecting van der Waals surfaces that would be excluded in this algorithm. References • Can, Tolga, Chao-I Chen, and Yuan-Fang Wang. "Efficient molecular surface generation using level-set methods ." Journal of Molecular Graphics and Modelling 25.4 (2006): 442-454 . doi:10.1016/j.jmgm.2006.02.012 • Chavent, Matthieu, Bruno Levy, and Bernard Maigret. "MetaMol: High-quality visualization of molecular skin surface." Journal of Molecular Graphics and Modelling 27.21 (2008): 209-216 . doi:10.1016/j.jmgm.2008.04.007 • Connolly, Michael L. "Molecular Surfaces: A Review." Network Science. 1996. 29 July 2009 <http://www.netsci.org/Science/Compchem/feature14.html>. • Hsieh, Hsien-Hsi, and Wen-Kai Tai. "A simple GPU-based approach for 3D Voronoi diagram construction and visualization." Simulation Modelling Practice and Theory 13.13 (2005): 681-692 . doi:10.1016/j.simpat.2005.08.003 • Sanner, Michel F., Arthur J. Olson, and Jean-Claude Spehner. "REDUCED SURFACE: an Efficient Way to Compute Molecular Surfaces." Biopolymers 38.3 (1996): 305-320. This step uses the non-intersecting van der Waals surface that was defined above and displays them in the visualization software. Voronoi diagram or Delaunay triangulation are used to build nearest-neighbor searches. Nearest neighbor searches will be used in this algorithm to find residues that are or within 2.4 Angstroms from each other. This step is the limiting step in the algorithm and has an average time complexity of O(N/k log N/K). Where N equals the number of atoms, and k equals the average number of atoms per residue. Levinthal Cubing could also be used for the nearest-neighbor search. Using the data from the search preformed in the last step, surfaces are drawn between nearest-neighbor residues. These surfaces are called reentrant surfaces. Acknowledgements • RIT College of Science • NIGMS 1 R15 AG16192-01 • NIGMS 3 R15 GM078077-01S1