Download
1 / 1
10 likes | 100 Views
Kinematic, Microphysical, and Precipitation Characteristics of MCSs in TRMM-LBA Robert Cifelli, Walter Petersen, Lawrence Carey, and Steven A. Rutledge Department of Atmospheric Science Colorado State University. Polarimetric Comparison. Height (km). Easterly. Westerly. 10 m s -1. 5 m s -1.

E N D
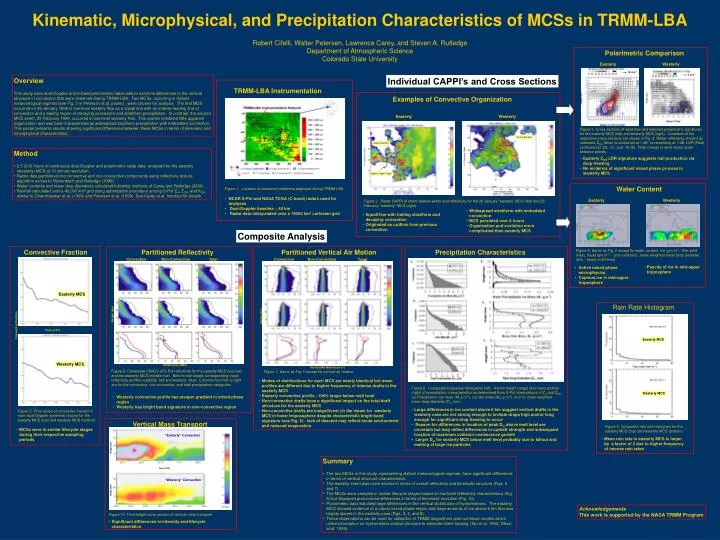
Kinematic, Microphysical, and Precipitation Characteristics of MCSs in TRMM-LBARobert Cifelli, Walter Petersen, Lawrence Carey, and Steven A. RutledgeDepartment of Atmospheric ScienceColorado State University Polarimetric Comparison Height (km) Easterly Westerly 10 m s-1 5 m s-1 Examples of Convective Organization TRMM-LBA Instrumentation Reflectivity (dBZ) Easterly Westerly Figure 3. Cross sections of wind flow and selected polarimetric signatures for the easterly MCS (left) and westerly MCS (right). Locations of the respective cross sections are shown in Fig. 2. Radar reflectivity shaded as indicated, ZDR (blue) is contoured at 1 dB, incrementing at 1 dB. LDR (Red) contoured at -23, -21, and -19 dB. Note change in wind vector scale between panels. Cross Section Cross Section • Easterly ZDR-LDR signature suggests hail production via drop freezing • No evidence of significant mixed phase process in westerly MCS Citation Flight Track Water Content Easterly Westerly Figure 2. Radar CAPPI of storm relative winds and reflectivity for the 26 January “easterly” MCS (left) and 25 February “westerly” MCS (right). • Figure 1. Location of instrument platforms deployed during TRMM-LBA. • NCAR S-Pol and NASA TOGA (C-band) radars used for analyses • Dual-Doppler baseline ~ 60 km • Radar data interpolated onto a 15000 km2 cartesian grid • Widespread stratiform with embedded convection • MCS persisted over 8 hours • Organization and evolution more complicated than easterly MCS • Squall line with trailing stratiform and decaying convection • Originated as outflow from previous convection Convective Fraction Partitioned Reflectivity Figure 4. Same as Fig. 3 except for water content. Ice (gm m-3 - thin solid lines), liquid (gm m-3 - color contours), mass weighted mean drop diameter (mm - heavy solid lines) Partitioned Vertical Air Motion Convective Non-Convective Total Convective Non-Convective Total • Paucity of ice in mid-upper troposphere • Active mixed phase microphysics • Copious ice in mid-upper troposphere Precipitation Characteristics Easterly MCS Rain Rate Histogram Height (km) Convective Fraction Time (UTC) Easterly MCS Westerly MCS Rain rate (mm hr-1) Figure 6. Composite CFAD’s of S-Pol reflectivity for the easterly MCS (top row) and the westerly MCS (middle row). Bottom row shows corresponding mean reflectivity profiles (easterly -red and westerly -blue). Columns from left to right are for the convective, non-convective, and total precipitation categories. Vertical Air Motion (m s-1) Figure 7. Same as Fig. 6 except for vertical air motion. • Modes of distributions for each MCS are nearly identical but mean profiles are different due to higher frequency of intense drafts in the easterly MCS • Easterly convective profile ~100% larger below melt level • Non-convective drafts have a significant impact on the total draft structure for the easterly MCS • Non-convective drafts are insignificant (in the mean) for westerly MCS in lower tropossphere despite characteristic bright band signature (see Fig. 6) - lack of descent may reflect moist environment and reduced evaporation Westerly MCS • Westerly convective profile has steeper gradient in mixed phase region • Westerly has bright band signature in non-convective region Figure 8. Composite frequency histograms (left - 4-8 km height range) and mean profiles (right) of precipitation characteristics as determined from S-Pol observations of ZH and ZDR. (a) Precipitation ice mass (Mi g m-3), (b) rain mass (Mw g m-3), and (c) mass weighted mean drop diameter (Dm mm). Figure 5. Time series of convective fraction in each dual-Doppler synthesis volume for the easterly MCS (top) and westerly MCS (bottom). Vertical Mass Transport Figure 9. Composite rain rate histogram for the easterly MCS (top) and westerly MCS (bottom). • MCSs were in similar lifecycle stages during their respective sampling periods • Large differences in ice content above 6 km suggest vertical drafts in the westerly case are not strong enough to levitate drops high and/or long enough for significantdrop freezing to occur • Reason for differences in location of peak Dm above melt level are uncertain but may reflect differences in updraft strength and subsequent location of maximum collision-coalescence growth • Larger Dm for easterly MCS below melt level probably due to fallout and melting of large ice particles “Easterly” Convection • Mean rain rate in easterly MCS is larger by a factor of 2 due to higher frequency of intense rain rates Height (km) Time (UTC) “Westerly” Convection Height (km) 109 kg s-1 Figure 10. Time-height cross section of vertical mass transport • Significant differences in intensity and lifecycle characteristics Overview This study uses dual-Doppler and S-band polarimetric radar data to examine differences in the vertical structure of convection that were observed during TRMM-LBA. Two MCSs, occurring in distinct meteorological regimes (see Fig. 3 in Petersen et al. poster) , were chosen for analysis. The first MCS occurred on 26 January 1999 in low-level easterly flow as a squall line with an intense leading line of convection and a trailing region of decaying convection and stratiform precipitation. In contrast, the second MCS event, 25 February 1999, occurred in low-level westerly flow. This system exhibited little apparent organization and was best characterized as widespread stratiform precipitation with embedded convection. This poster presents results showing significant differences between these MCSs in terms of kinematic and microphysical characteristics. Individual CAPPI’s and Cross Sections • Method • 2.5 (3.0) hours of continuous dual-Doppler and polarimetric radar data analyzed for the easterly (westerly) MCS at 10 minute resolution. • Radar data partitioned into convective and non-convective components using reflectivity texture algorithm similar to Rickenbach and Rutledge (1998). • Water contents and mean drop diameters calculated following methods of Carey and Rutledge (2000). • Rainfall calculated over a 40,000 km2 grid using optimization procedure among S-Pol ZH, ZDR, and KDP, similar to Chandrasekar et al. (1993) and Petersen et al. (1999). See Carey et al. handout for details. Composite Analysis • Summary • The two MCSs in this study, representing distinct meteorological regimes, have significant differences in terms of vertical structure characteristics. • The easterly event was more intense in terms of overall reflectivity and kinematic structure (Figs. 6 and 7). • The MCSs were sampled in similar lifecycle stages based on low-level reflectivity characteristics (Fig. 5) but displayed pronounced differences in terms of kinematic evolution (Fig. 10). • Polarimetric data indicated large differences in the vertical distribution of hydrometeors. The easterly MCS showed evidence of a robust mixed phase region and large amounts of ice above 6 km that was largely absent in the westerly case (Figs. 3, 4, and 8). • These observations can be used for validation of TRMM alogorithms and numerical models which utilize information on hydrometeor vertical structure to estimate latent heating (Tao et al. 1993; Olson et al. 1999). Acknowledgements This work is supported by the NASA TRMM Program