Download
1 / 48
480 likes | 590 Views
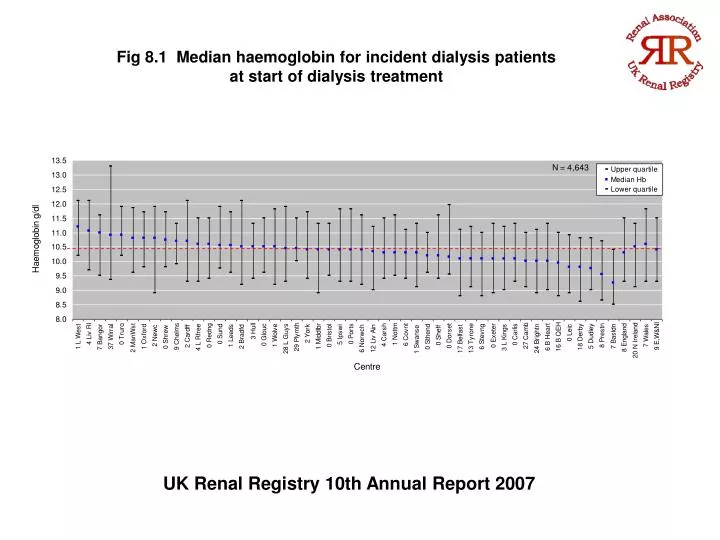
Fig 8.1 Median haemoglobin for incident dialysis patients at start of dialysis treatment. UK Renal Registry 10th Annual Report 2007. Fig 8.2 Percentage of incident dialysis patients with Hb ≥10g/dl at start of dialysis treatment. UK Renal Registry 10th Annual Report 2007.

E N D
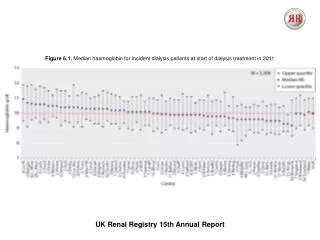
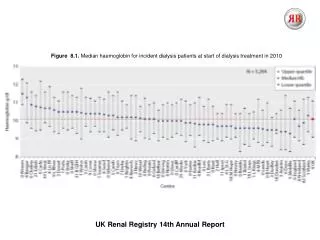
Fig 8.1 Median haemoglobin for incident dialysis patients at start of dialysis treatment UK Renal Registry 10th Annual Report 2007
Fig 8.2 Percentage of incident dialysis patients with Hb ≥10g/dl at start of dialysis treatment UK Renal Registry 10th Annual Report 2007
Fig 8.3 Distribution of haemoglobin in incident dialysis patients at start of dialysis treatment UK Renal Registry 10th Annual Report 2007
Fig 8.4 Median haemoglobin, by time on dialysis, for incident dialysis patients in 2005 UK Renal Registry 10th Annual Report 2007
Fig 8.5 Percentage of incident dialysis patients in 2005 with Hb ≥10g/dl, by time on dialysis UK Renal Registry 10th Annual Report 2007
Fig 8.6 Haemoglobin in incident patients at the start of RRT by year of start UK Renal Registry 10th Annual Report 2007
Fig 8.7 Median haemoglobin: HD UK Renal Registry 10th Annual Report 2007
Fig 8.8 Percentage of HD patients with Hb ≥10g/dl UK Renal Registry 10th Annual Report 2007
Fig 8.9 Percentage of HD patients with Hb ≥11g/dl UK Renal Registry 10th Annual Report 2007
Fig 8.10 Distribution of haemoglobin in patients on HD UK Renal Registry 10th Annual Report 2007
Fig 8.11 Percentage of HD patients with Hb ≥10.5 and ≤12.5g/dl UK Renal Registry 10th Annual Report 2007
Fig 8.12 Funnel plot for percentage of HD patients with Hb ≥10.5 and ≤12.5g/dl UK Renal Registry 10th Annual Report 2007
Fig 8.13 Funnel plot for percentage of HD patients with Hb ≥10g/dl UK Renal Registry 10th Annual Report 2007
Fig 8.14 Median haemoglobin: PD UK Renal Registry 10th Annual Report 2007
Fig 8.15 Percentage of PD patients with Hb ≥10g/dll UK Renal Registry 10th Annual Report 2007
Fig 8.16 Percentage of PD patients with Hb ≥11g/dl UK Renal Registry 10th Annual Report 2007
Fig 8.17 Percentage of PD patients with Hb ≥10.5 and ≤12.5 g/dl UK Renal Registry 10th Annual Report 2007
Fig 8.18 Distribution of haemoglobin in patients on PD UK Renal Registry 10th Annual Report 2007
Fig 8.19 Funnel plot for percentage of PD patients with Hb ≥10g/dl UK Renal Registry 10th Annual Report 2007
Fig 8.20 Percentage of new and prevalent dialysis patients with Hb ≥10g/dl UK Renal Registry 10th Annual Report 2007
Fig 8.21 Percentage of patients with Hb ≥10g/dl plotted against median haemoglobin: HD UK Renal Registry 10th Annual Report 2007
Fig 8.22 Percentage of patients with Hb ≥11g/dl plotted against median haemoglobin: HD UK Renal Registry 10th Annual Report 2007
Fig 8.23 Percentage of patients with Hb ≥10g/dl plotted against median haemoglobin: PD UK Renal Registry 10th Annual Report 2007
Fig 8.24 Percentage of patients with Hb ≥11g/dl plotted against median haemoglobin: PD UK Renal Registry 10th Annual Report 2007
Fig 8.25 Percentage of prevalent HD and PD patients with Hb ≥10g/dl: 1997-2006 UK Renal Registry 10th Annual Report 2007
Fig 8.26 Percentage of incident and prevalent dialysis patients with Hb ≥10g/dl: 1998-2006 UK Renal Registry 10th Annual Report 2007
Fig 8.27 Median haemoglobin by length of time on RRT: HD UK Renal Registry 10th Annual Report 2007
Fig 8.28 Median haemoglobin by length of time on RRT: PD UK Renal Registry 10th Annual Report 2007
Fig 8.29 Median serum ferritin: HD UK Renal Registry 10th Annual Report 2007
Fig 8.30 Median serum ferritin: PD UK Renal Registry 10th Annual Report 2007
Fig 8.31 Percentage of HD patients with serum ferritin ≥100µg/L UK Renal Registry 10th Annual Report 2007
Fig 8.32 Percentage of HD patients with serum ferritin ≥200µg/L UK Renal Registry 10th Annual Report 2007
Fig 8.33 Percentage of HD patients with serum ferritin ≥800µg/L UK Renal Registry 10th Annual Report 2007
Fig 8.34 Percentage of PD patients with serum ferritin ≥100µg/L UK Renal Registry 10th Annual Report 2007
Fig 8.35 Percentage of PD patients with serum ferritin ≥200µg/L UK Renal Registry 10th Annual Report 2007
Fig 8.36 Percentage of PD patients with serum ferritin ≥800µg/L UK Renal Registry 10th Annual Report 2007
Fig 8.37 Change in achievement of serum ferritin ≥100µg/L: 1999-2006 UK Renal Registry 10th Annual Report 2007
Fig 8.38 Change in median serum ferritin: 1999-2006 UK Renal Registry 10th Annual Report 2007
Fig 8.39 Median serum ferritin by length of time on RRT: HD UK Renal Registry 10th Annual Report 2007
Fig 8.40 Median serum ferritin by length of time on RRT: PD UK Renal Registry 10th Annual Report 2007
Fig 8.41 Percentage of patients who are not on ESA and have Hb ≥10g/dL, by age group and modality UK Renal Registry 10th Annual Report 2007
Fig 8.42 Percentage of dialysis patients on ESA, by age group and modality UK Renal Registry 10th Annual Report 2007
Fig 8.43 Percentage of patients with Hb <10g/dl who are on ESA, by age group and modality UK Renal Registry 10th Annual Report 2007
Fig 8.44 Provision of ESA by age and gender: HD UK Renal Registry 10th Annual Report 2007
Fig 8.45 Provision of ESA by age and gender: PD UK Renal Registry 10th Annual Report 2007
Fig 8.46 Percentage of patients on ESA by time on RRT UK Renal Registry 10th Annual Report 2007
Fig 8.47 Median haemoglobin versus mean ESA dose in haemodialysis patients UK Renal Registry 10th Annual Report 2007
Fig 8.48 Compliance with European Best Practice Guidelines versus mean ESA dose in haemodialysis patients UK Renal Registry 10th Annual Report 2007