Download
1 / 23
230 likes | 358 Views
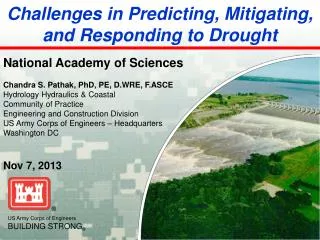
Responding to Drought (and other) Conditions on the Colorado River Urban Water Institute’s 21 st Annual Conference August 14, 2014. Natural Flow Colorado River at Lees Ferry Gaging Station, Arizona Water Year 1906 to 2014. State of the System (Water Years 1999-2014) 1.

E N D
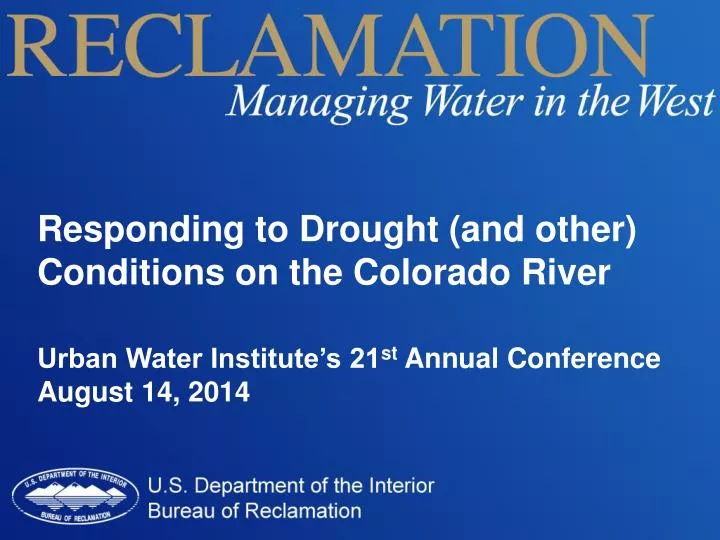
Responding to Drought (and other) Conditions on the Colorado River Urban Water Institute’s 21st Annual Conference August 14, 2014
Natural FlowColorado River at Lees Ferry Gaging Station, ArizonaWater Year 1906 to 2014
Water Year Snowpack and Precipitationas of August 11, 2014 Colorado River Basin above Lake Powell Water Year 2014 Precipitation (year-to-date) 99% of average Current Snowpack NA Chart developed with SNOTEL data as of August 11, 2014 Snowpack peaked at 111% on April 7, 2014
Upper Basin Storage April to July Observed Unregulated Inflow (Issued August 1) Basin StorageAs of 8/3/2014 100% 88% 80% 67% 52% 1 1981-2010 period http://www.usbr.gov/uc/water/basin/tc_cr.html
Colorado River Basin Storage(as of August 10, 2014) *Total system storage was 30.10 maf or 50% this time last year
Water Budget at Lake Mead Given basic apportionments in the Lower Basin, the allotment to Mexico, and an 8.23 maf release from Lake Powell, Lake Mead storage declines • Inflow = 9.0 maf (release from Powell + side inflows) • Outflow = - 9.6 maf (AZ, CA, NV, and Mexico delivery + downstream regulation and gains/losses) • Mead evaporation loss = - 0.6 maf • Balance = - 1.2 maf Data based on long-term averages
QSA-RELATED WATER TRANSFERS CALIFORNIA IID to CVWD: Up to 103,000 af/yr IID to MWD: Up to 110,000 af/yr IID&CVWD to SLR: Up to 16,000 af/yr IID to Salton Sea Mitigation: Up to 150,000 af/yr through 2017 CVWD to SDCWA: 21,500 af/yr from CCLP IID to SDCWA: Up to 200,000 af/yr + 56,200 af/yr from AAC Lining
LOWER COLORADO RIVER MSCP PURPOSE Multi-stakeholder Federal and non-Federal partnership responding to the need to balance the use of lower Colorado River (LCR) water resources and the conservation of native species and their habitats in compliance with the Endangered Species Act.
Interim Guidelines for Operation of Lake Powell and Lake Mead • In place for an interim period (through 2026) • Key provisions: • Operation for Lake Powell and Lake Mead is specified throughout the full range of operation • Strategy for shortages in the Lower Basinis specified, including a provision for additional shortages if warranted • Mechanism (Intentionally Created Surplus or ICS) is established to encourage efficient and flexible water use in the Lower Basin
Lake Powell & Lake MeadOperational Diagrams and Current Conditions 3,608 12.49 8/10/14 8/10/14 1,080 10.03 8/10/14 8/10/14
Minute 319 • 5-year interim bi-national agreement • Promotes sharing, conserving and storing water • Demonstrates shared commitment to cooperation and partnership • Components include: • Ability to defer delivery of water/ICMA • High/low reservoir operation • Water for the Environment-ICMA->ICS Exchange Pilot • Study of future joint projects November 20, 2012 Signing Ceremony
Projected Future Colorado River Basin Water Supply and Demand
Lake Mead Capacity 1,219.6 ft 26.1 maf Surplus Conditions 140 ft 16.2 maf 1,145 ft Normal or ICS Surplus Conditions 10.03 maf (38% of Live Capacity) 1,080 ft 30 ft 1,075 ft Shortage Conditions Min Power Pool 1,050 ft Inactive Pool (7.7 maf) Lower SNWA Intake 1,000 ft Dead Pool Elevation 895 ft Dead Pool (2.5 maf) As of Aug 10, 2014 Not to scale
Risk • Risk can be viewed as the chance (or probability) an event will occur times the consequence if the event does occur • risk = chance X consequence • To quantify the risk of an event: • Must assess the chance • Must assess the consequence • Dealing with risk • Determine what risks need to be mitigated (i.e., what is our tolerance of the assessed risk?) • Determine activities/actions that will mitigate those risks • Update as the future unfolds
Responding to Drought (and other) Conditions on the Colorado River