Download
1 / 42
420 likes | 567 Views
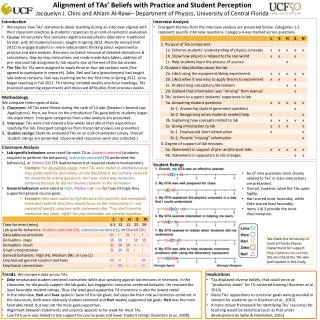
IDEA Student Ratings of Instruction Update. Carrie Ahern and Lynette Molstad. Selected slides reproduced with permission of Dr. Amy Gross from The IDEA Center. www.idea.ksu.edu. Presentation. Process at DSU for online IDEA surveys Review IDEA - Student Ratings of Instruction system Forms

E N D
IDEA Student Ratings of Instruction Update Carrie Ahern and Lynette Molstad Selected slides reproduced with permission of Dr. Amy Gross from The IDEA Center www.idea.ksu.edu
Presentation • Process at DSU for online IDEA surveys • Review IDEA - Student Ratings of Instruction system • Forms • Reports • Questions
Process for IDEA Surveys • Faculty receive e-mail for each course with a link to the FIF (new copy feature) • Faculty receive unique URL for each course- must provide this to students • Faculty receive status update on how many students completed • Questions
IDEA as a Diagnostic to Guide Improvement And as a Tool to Evaluate Teaching Effectiveness
IDEA Student Ratings of Instruction The Student Learning Model
Student Learning Model • Types of learning must reflect instructor’s purpose • Effectiveness determined by student progress on objectives stressed by instructor
IDEA Student Ratings of Instruction Overview Faculty Information Form Student Survey - Diagnostic Form
IDEA: FIF Faculty Information Form
Faculty Information Form • Some thoughts on selecting objectives http://www.theideacenter.org/SelectingObjectives Video for Faculty on completing the FIF http://www.theideacenter.org/FIFVideo
Faculty Information Form • One FIF per class being evaluated • Course Information • IDEA Department Codes • Extended list: http://www.idea.ksu.edu/StudentRatings/deptcodes.html • 12 Learning Objectives • Course Description Items • Optional • Best answered toward end of semester
FIF: Selecting Objectives • 3-5 as “Essential” or “Important” • Is it a significant part of the course? • Do you do something specific to help students accomplish the objective? • Does the student’s progress on the objective influence his or her grade? • In general, progress ratings are negatively related to the number of objectives chosen. • Research Note 3
Best Practices • Multi-section courses • Curriculum committee review • Prerequisite-subsequent courses • Discuss meaning of objectives with students • Incorporate into course syllabus
New feature- as of 2/2010 • Copy FIF objectives from one course to another • Previous FIFs will be available in a drop down menu (linked by faculty e-mail address)
Student Survey Diagnostic Form http://theideacenter.org/sites/default/files/Student_Ratings_Diagnostic_Form.pdf
Student Survey: Diagnostic Form • Teaching Methods: Items 1-20 • Learning Objectives: Items 21-32 • Student and Course • Student Characteristics: Items 36-39, 43 • Course Management/Content: Items 33-35 • Global Summary: Items 40-42 • Experimental Items: Items 44-47 • Extra Questions: Items 48-67 • Comments
False Assumptions • Effective instructors effectively employ all 20 teaching methods. • The 20 teaching methods items are used to make an overall judgment about teaching effectiveness. • Students should make significant progress on all 12 learning objectives
Resources: Administering IDEA • www.idea.ksu.edu • Client Resources • IDEA Resources • Best practices • Directions to Faculty • Using Additional Questions • Some Thoughts on Selecting IDEA Objectives • Disciplinary Selection of Learning Objectives • Guide to Administering IDEA • Team Teaching All resources on our website.
ReportBackground Comparison Groups Converted Scores
The Report: Comparative Information • Comparison Groups • IDEA • Discipline • Institution
Comparison Groups (norms) • IDEA Comparisons • Diagnostic Form • Exclude first time institutions • Exclude classes with fewer than 10 students • No one institution comprises more than 5% of the database • 128 institutions • 44,455 classes • Updated only periodically
Comparison Groups (norms) • Discipline Comparisons • Updated annually (September 1) • Most recent 5 years of data • Approximately July 1-June 30 • Exclusions same as IDEA Comparisons • Also exclude classes with no objectives selected • Minimum of 400 classes
Comparison Groups (norms) • Institutional Comparisons • Updated annually (September 1) • Most recent 5 years of data • Approximately July 1-June 30 • Most recent 5 years of data • Includes Short and Diagnostic Form • Exclude classes with no objectives selected • Minimum of 400 classes
Norms: Converted Averages • Method of standardizing scores with different averages and standard deviations • Able to compare scores on the same scale • Use T Scores • Average = 50 • Standard Deviation = 10 • They are not percentiles
ReportBackground Adjusted Scores
Adjusted Scores • Control for factors beyond instructor’s control • Regression equations • Link to video clip explaining Adjusted Scores http://theideacenter.org/taxonomy/term/109
Adjusted Scores: Diagnostic Form • Student Work Habits (#43) • Student Motivation (#39) • Class Size (Enrollment, FIF) • Student Effort (multiple items) • Course Difficulty (multiple items)
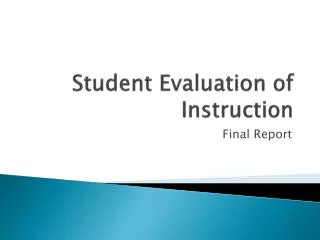
The IDEA Report • Diagnostic Form Report • What were students’ perceptions of the course and their learning? • What might I do to improve my teaching?
Questions Addressed: Page 1 • What was the response rate and how reliable is the information contained in the report? • What overall estimates of my teaching effectiveness were made by students? • What is the effect of “adjusting” these measures to take into consideration factors I can’t control? • How do my scores compare to other comparison groups?
Questions Addressed: Page 2 • How much progress did students report on the learning objectives that I identified as “Essential”? • How does this progress compare to the available comparison groups? • How much progress did students report on the “Important” objectives? • How does this progress compare to the available comparison groups? • Do conclusions change if “adjusted” rather than “raw” ratings are used?
Progress on Specific Objectives 4.1+4.1 4.0+4.0 +3.8 +3.9 6
Questions Addressed: Page 3 • Which of the 20 teaching methods are most related to my learning objectives? • How did students rate my use of these important methods? • What changes should I consider in my teaching methods? • Do these results suggest some general areas where improvement efforts should focus?
Improving Teaching Effectiveness • IDEA Website: http://theideacenter.org/ • IDEA Papers http://www.theideacenter.org/category/helpful-resources/knowledge-base/idea-papers
Questions Addressed: Page 2 • How distinctive is this class with regard to the amount of reading, amount of other work (non-reading) and the difficulty of the subject matter? • How distinctive is this class with regard to student self-ratings?
Questions Addressed: Page 4 • What was the average rating on each of the questions on the IDEA form? • How much variation was there in these ratings? • Are the distributions of responses relatively “normal” (bell-shaped) or is there evidence of distinctive subgroups of students? • What are the results for the additional questions I used?