Download
1 / 2
20 likes | 142 Views
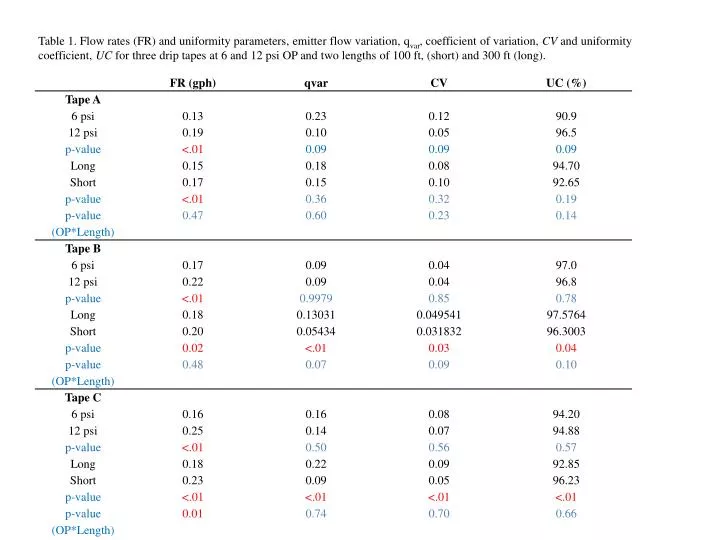
Table 1. Flow rates (FR) and uniformity parameters, emitter flow variation, q var , coefficient of variation, CV and uniformity coefficient, UC for three drip tapes at 6 and 12 psi OP and two lengths of 100 ft, (short) and 300 ft (long).

E N D
Table 1. Flow rates (FR) and uniformity parameters, emitter flow variation, qvar, coefficient of variation, CV and uniformity coefficient, UC for three drip tapes at 6 and 12 psi OP and two lengths of 100 ft, (short) and 300 ft (long).
Table 2. Seasonal fresh market tomato yieldsz in number of 25-lb cartons per acre for 2008y and 2009. z Values with different letters within the same column and under a specific treatment effect are significantly different at α=0.05 using Duncan’s multiple range test . y Tomato yields were separated into various categories based on grading. Total: marketable and culls; Total Mkt: marketable; X-L: extra-large grade; L – large grade; M – medium grade.