Download

1 / 36
630 likes | 877 Views
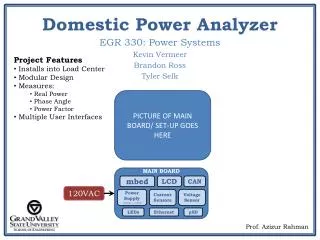
Fluke 430 Series Power Quality Analyzer. Turn-Key Solution. I400S: 400 Amp AC clamp. The Front Panel - Simple. Function Keys. Arrows. Main Functions Scope Menu Monitor. Setup Memory Save screen. Backlight. On/Off. Enter.

E N D
Turn-Key Solution I400S: 400 Amp AC clamp
The Front Panel - Simple Function Keys Arrows • Main Functions • Scope • Menu • Monitor Setup Memory Save screen Backlight On/Off Enter Pressing Enter for 5 sec will lock the keyboard. Repeating this will unlock it.
The main set-up screen • User name – editable in user preference • Real time clock/calendar • Wiring Configuration • Color codes • Freq & Nominal voltage • Limit setting: EN50160 default • Probes and scaling
Wiring configurations 434 configures wiring internally, eliminating need to make unique connections for each configuration 3 phase WYE and DELTA systems are the most common configurations.
Scope Function • Application: Use the Scope function to verify correct connections • For a three-phase system, you should see something like the two screens show here. • Use F3 to toggle between scope and phasor display • F1 allows you to view individual parameters (V, A) or individual phase (L1, L2, L3, N)
MenuVolts / Amps / Hertz Application: check basic system parameters quickly. Are voltage and current within expected range
AutoTrend: every reading is always recorded Elapsed time The trend builds in the background, as soon as you select a function from the menu. The “tape” icon shows when you’re recording AutoTrend also with Dips & swells, Harmonics, flicker power and energy measurements
Every reading is automatically recorded:All 3 phases and Neutral 7 different displays with 25 trend graphs in V/A/Hz mode
Want more detail?Use “Vertical ZOOM” to view individual Graphs Focus at a single trace at a time Full screen display Min Max Avg readings
Want more detail?Use “Vertical ZOOM” to view individual Graphs Want to see the other graphs as well? …..25 Individual graphs
Want more detail?Use “Horizontal ZOOM” to view more or less time Up to 6 x ZOOM 1800 min/max/avg data points per trend
Use cursors to Analyze Waveform select + Vertical Zoom Waveform select Cursor remains at same time across all screens to determine timing relations be different parameters
Cursors and ZOOM; Summary • Horizontal zoom: • lets you look at more or less time • Vertical zoom • lets you focus on one trace at a time • Cursors turned off • the readings at the top of the display are the latest readings • Cursors turned on • the cursor gives rms reading for all trends at that time • and vertical zoom readings are min/max/and avg for the single trend at that time
Timed start/stop of Trend graph By pressing HOLD/RUN in the trend screen, you can program the trend recording to start at a later date and time.
Dips & Swells Voltage and Current trend graphs are recorded simultaneously By trend the cursor will highlight the specific event
What’s a Dip (sag), swell or interruption? Dip Interruption Swell • Dips, swell and interruptions are characterized by duration, magnitude and time of occurrence • Starts when from one of the phases the voltage goes below/above the threshold • Stops when all phases are above/below the threshold + hysteresis. • Levels and duration are initially specified by EN 50160 or can be user-defined
Rapid Voltage change A quick change of the RMS voltage between two steady voltages.
Measuring harmonics with the Fluke 430Harmonics & Spectrum Analysis The spectrum shows how much of each harmonic frequency is present in a waveform • The Fluke 430 can display the spectrum for • Voltage • Current • Power • Display as a bar chart or as a table • Up to 50th Harmonic • Measure Harmonic as %R (total Harmonic Voltage) or %F (fundamental voltage)
Power & Energy • Measures • Real power (kW) • Apparent power (kVA) • Reactive power (kVAR) • Indicates inductive (lagging) or capacitive (leading) power factor • Autotrend every reading. • 7 measurements for 3 phases + neutral • Use Cursor and zoom
Power & Energy • You can record kWh for any length of time • You can also track KVAh and KVARh which are apparent and reactive power integrated over time (energy).
Power & Energy • If you press the HOLD/RUN while in the Power measurement you can get to the “Timed Start” screen • You can set the time to perform demand interval measurements • Most utilities use 15-minute or 30-minute period to measure the demand in that period
Power Consumption (Demand) • The Fluke 430 will give the Min/Max/Avg value for the total 3-phase power (kW) over an entire recording • The highest average value will be the peak demand. • Position cursor at highest point of the graph
Verify KYZ Meters Pulse Counter Probe • Optional ITP120 Pulse Count Probe helps field-verify KYZ pulse-output revenue meters • Counts each transition on a set of “form C” relay contacts Is the meter working? Compare the reading on the 430 to the number of pulses coming out of the meter. www.cs.rice.edu/~dwallach/ seattle95/meter.jpg
Flicker Measurements • A reading greater than 1 means that most people will perceive flicker in an incandescent bulb • Measures • Pst (1 min): Short-term flicker over 1 minute • Pst: Short-term flicker over 10 minutes • Plt: Long-term flicker over 2 hours • “D-parameters” track voltage fluctuations for appliance testing per IEC 61000-3-3.
Instantaneous Flicker PF5 • Think of PF5 as flicker before all the averaging. It updates almost instantly. • The trend of instantaneous flicker (PF5) allows for quick correlation of flicker with voltage and current trends. • Use the F1 trend selector and Up/Down arrow keys to compare PF5 to the rms voltage. This makes it easier to pinpoint the voltage events driving the flicker reading.
Unbalance • The phasor diagram gives a quick indication of phase relationships and balance • Bold vectors indicate voltage • Thin vectors show current • The ratios of negative/positive and zero/positive both indicate unbalance • In this example voltage unbalance is very small, but current unbalance is nearly 19%.
Automatic Transient Capture Use this mode when you need to see any event (not just transients) as a set of voltage and current waveforms. • Trigger on • Instantaneous voltages like transients • Half-cycle rms values like dips, swells, interruptions and current. • See the waveform in real time or look at captured waveforms, even while the 430 is monitoring. • Transients can be as short as 5us (200kS/s) and up to 6kV amplitude. • Cursors and zoom function help with the analysis. • Up to 40 events can be captured • dips and swells mode captures rms events at 10msec resolution
Automatic Transient capture • An event on any phase triggers a capture of Voltage and current waveforms on all phases and neutral
Inrush Current Inrush current: • Occurs during motor start-up (across-the-line starters) • Can be12 times running current on energy efficient motors(5 times on older motors) • Problems: • Can cause voltage sags • Nuisance trips of motors Inrush screen capture
The Inrush Measurement • The top of the inrush screen shows rms currents that signaled the beginning and end of the inrush • Inrush time which is also indicated by vertical dashed lines marking the start and stop of the inrush • If cursor is turned off, the phase values at the top of the screen are the rms of all values on the screen (an rms of rms!) • If the cursor is on then the phase values at the top of the screen are the current readings at the cursor
Monitor system performance • Monitor system performance inline with EN50160 or user-defined limits • Looks for • RMS voltage • Harmonics • Flicker • Dips, swells, interruptions, and “rapid voltage changes” • Unbalance • Frequency • Records • Just about everything!! • For a week!
How to read the display Upper limit as specified by EN50160 Small: Maximum voltage measured relative to upper limit Lower limit as specified by EN50160 Wide: Avg voltage measured relative to lower limit Red indicates upper limit is exceeded. Example: 100% of the 10 min avg readings should be within +10/-15%. At least one reading exceeded this limit Plt reading • Number of events • Dips, interruptions, “rapid voltage changes” and swells
System Monitor – Drill Down Congratulations! You have experienced high voltage harmonics! Which harmonic was it? When was it?
Memory Functions • Screen memories store screens as pictures • Dataset memories store all of the data behind the active measurement (e.g. Volts, Amps, Hz trend and System Monitor Events) • Datasets can be “Used” (analyzed) on the instrument, as if you had just taken the measurements! • Use RENAME to annotate data sets with locations, circuit or panel numbers
FlukeView Share Your Data • Screen captures and export functions help generate professional reports. • Transfer “raw” binary memory images, screens, waveform data, trend data to the PC. • Use cursors and compare waveforms on your PC • Remote control function (shown at right) is great for use with overhead LCD projectors. • Create and modify monitoring limits and keep a library of templates on your PC. • FlukeView 430 PC Software is included with the Fluke 434 and is available separately or as part of the 433 UGK Interface Cables and PC Software • PM9080 Optical Cable • OC4USB Optical Cable for USB • SW43W FlukeView Power Quality Analyzer