Download
1 / 11
110 likes | 202 Views
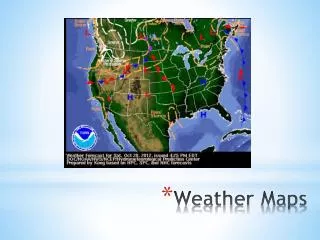
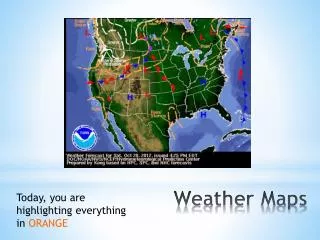
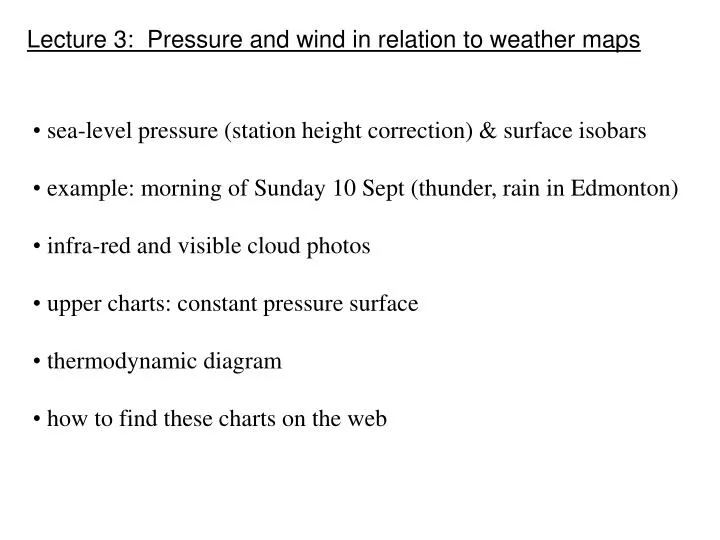
Lecture 3: Pressure and wind in relation to weather maps. sea-level pressure (station height correction) & surface isobars example: morning of Sunday 10 Sept (thunder, rain in Edmonton) infra-red and visible cloud photos upper charts: constant pressure surface thermodynamic diagram

E N D
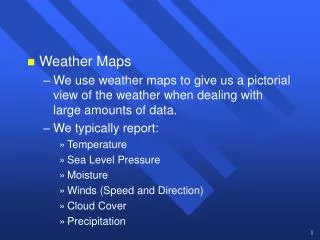
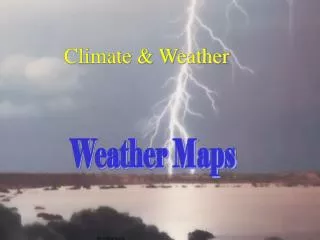
Lecture 3: Pressure and wind in relation to weather maps • sea-level pressure (station height correction) & surface isobars • example: morning of Sunday 10 Sept (thunder, rain in Edmonton) • infra-red and visible cloud photos • upper charts: constant pressure surface • thermodynamic diagram • how to find these charts on the web
false air column sea-level Sea-level pressure versus “surface” or “station” pressure (p98) • we’ve seen that pressure varies rapidly with height (about 10 Pa m-1) • horizontal pressure gradients control the wind, so we need to compare pressures at different places at the same altitude – by convention, this is taken to be sea-level • what is done is to consider a fictitious column of air from ground-level down to sea-level, and to assign this a temperature; then the hydrostatic law is used to compute an effective sea-level pressure (we’ll ignore the details) • this is what is plotted on the surface analysis elevated station
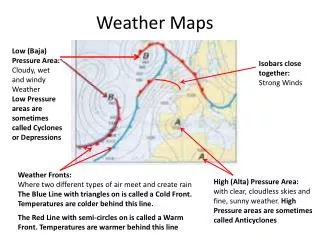
weak low • counter-clockwise wind • overcast in Edmonton • thunderstorm • Edmonton pressure 1009.0 mb • pressure on the central contour? • high Ab dewpoints
SIGNIFICANT WEATHER DISCUSSION FOR THE CANADIAN PRAIRIES ISSUED BY THE PRAIRIE AND ARCTIC STORM PREDICTION CENTRE OF ENVIRONMENT CANADA AT 7:00 AM CDT SUNDAY SEPTEMBER 10 2006. DISCUSSION... A FEW NOCTURNAL THUNDERSTORMS HAVE DEVELOPED OVERNIGHT ALONG A SURFACE TROUGH WEST OF EDMONTON. THIS TROUGH WIL MOVE EASTWARD TO THE ALBERTA -SASKATCHEWAN BORDER BY THIS AFTERNOON AND A FEW THUNDERSTORMS WILL PERSIST ALONG THIS FEATURE. NONE EXPECTED TO BE SEVERE.
zone of high cloud over YEG • also lower (warmer) cloud • note the texture on the vis. Interpretation of satellite cloud photos, P414 Aguado & Burt
by 0930 MDT only lower cloud • thinning (sun visible) by about 11
Height of the 500 mb surface At any point on the earth’s surface, the 500 mb height is defined as the height above sea-level at which atmospheric pressure has dropped to 500 mb. Lines of constant 500 mb height are called “isolines” or “contours” of 500 mb height, and labelled in decameters (“dam”), where 1 dam = 10 m
500 mb height at Edmonton 569 dam • wind aloft follows contours • trough upstream of Edmonton • generally westerly flow aloft onto Ab • T = ? and T-Td = ? See pp103-5 & Fig. 4-9 Horizontal gradient in height of a constant p sfc is equivalent to horiz. gradient in pressure on a constant height sfc CMC 500 mb analysis, Sunday 10 Sept.06 at 12Z
Thermodynamic diagram (p415-416), here the “Stuve diagram” • wind shear • moist aloft T Td p
The “skew T – log P” diagram is more common • wind shear • tropopause • moist aloft T Td p
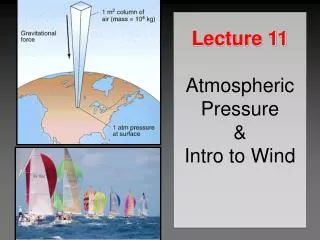
Summary • pressure field determines the wind field on the synoptic scale • counter-clockwise winds about a low spiral toward centre • convergence into the low ascent cloud & precip • satellite images extremely useful for short term trends • upper maps are plotted on a constant pressure surface • thermodynamic diagram useful to show local state of atmos