Download
1 / 13
130 likes | 466 Views
A comparison between the cost curves in the RAINS-model and the Swedish environmental quality objectives Catarina Sternhufvud Peringe Grennfelt IVL Limited influence on climate Clean air Natural acidification only A non-toxic environment A protective ozone layer

E N D
A comparison between the cost curves in the RAINS-model and the Swedish environmental quality objectives Catarina Sternhufvud Peringe Grennfelt IVL
Limited influence on climate Clean air Natural acidification only A non-toxic environment A protective ozone layer A safe radiation environment No eutrophication Flourishing wetlands High-quality groundwater A balanced marine environment, sustainable coastal areas and archipelagos Flourishing wetlands Sustainable forests A varied agricultural landscape A magnificent mountain landscape A good urban environment Swedish Environmental Quality Objectives (SEQO)
Objectives included in the cost calculations • 4 objectives included in the cost calculations: • Clean air; • Natural acidification only; • No eutrophication; • Limited influence on climate.
“SEQO” - the Swedish approach • Allocation of costs between SO2, NOX, VOC, PM and CO2. • Creation of cost curves • “Negative costs”
Energy conservation measures and structural changes • ’Non-technical’ measures included in the cost curves. • 30% of suggested measures are “non-technical” • Examples: • Restrict the speed on the roads; • Energy efficient buildings; • Process related energy savings.
Emission targets for NOX 2010 SEQO IIASA
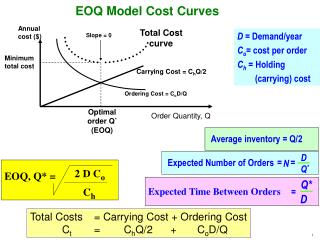
Estimated costs to reach MFR • To reach MFR costs according to RAINS 3125 Euro/ton NOX reduced. • The Swedish approach estimates the same cost to -375 Euro/ton NOX reduced.
Conclusions • The negative costs and the allocation of costs have a major impact; • Non-technical measures are cheap, but do not reduce a lot; • 60% of the NOX measures needed to reach the medium ambition are non-technical, but they only reduce 24% of the NOX emissions.
Conclusions • High uncertainty and many assumptions; • Bill to the parliament in May 2001; • Good intention.
Proposed targets 2010 • NOX 148 000 tons (148’) • SO2 60 000 tons (67’) • VOC 241 000 tons (241’) • NH3 51 700 tons (57’)
Allocation of costs The allocation of cost to one pollutant depends on how the measure influence this pollutant’s gap between today’s emission and the environmental target (critical load) and how this relationship is in relation to the other pollutants’ gaps.
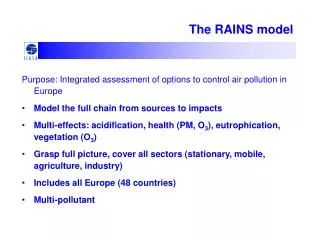
Main objective Compare the methodologies used in RAINS and in the Swedish approach to attain cost-efficiency.