Download
1 / 41
430 likes | 618 Views
Ion Information and Elemental Patterns. Chapter 6 (Hoffmann & Stroobant) Chapter 1 (Johnstone and Rose, 1996). Two Main Facets of Mass Spectrometry. Compared with most other common methods of physicochemical spectroscopic analysis, some or all of the samples is consumed.

E N D
Ion Information and Elemental Patterns Chapter 6 (Hoffmann & Stroobant) Chapter 1 (Johnstone and Rose, 1996)
Two Main Facets of Mass Spectrometry • Compared with most other common methods of physicochemical spectroscopic analysis, some or all of the samples is consumed. • MS does not deal with a well-defined property of a molecule. The appearance of a mass spectrum depends on the compounds itself but also upon the interval of time between ionization and detection, initial energy distribution in the molecule, ionization method, etc…
MS Spectral Collections and Database • NIST/EPA/NIH: >190,000 spectra (over 163,000 compounds) • Wiley Registry of Mass Spectral Data: 380,000 spectra (over 200,000 compounds) • Eight-Peak Index of Mass Spectra: 81,000 spectra (over 65,000 compounds)
%RIC? Used when background and unwanted impurities are removed %RA is affected by the error in measuring base peak
Metastable ions • The ions in a mass spectrometer that have sufficient energy to fragment sometime after leaving the ion source but before arriving at the detector. • M+ A+ + N (m1/z) (m2/z) (m1-m2) • M+ with large amount of internal energy will fragment in the ionization source, producing “normal” A+ ions. These A+ ions will be seen as narrow peaks at m/z values correct for the mass and charge on the ion A+. 2. M+, having only a small excess of internal energy, reach detector before decomposition can occur. Narrow peaks for “normal” M+ appear. 3. M+ which posses excesses of internal energy that are in between the those in above two cases, may fragment after leaving the ion source and before reaching the detector. The product ions, A+, are seen in the mass spectrum as broad peaks, centered at m/z values that are nor correct for the mass and charge on the ion A+.
Metastable ions • These broad peaks are called “metastable ion peaks” • These ““metastable ion peaks” do not represent metastable M+ ions, but represent products of decomposition of metastable ions. • The cause of A+ ions from metastable ion decomposition being detected differently form “normal” A+ ions is due to their different momenta.
93 66
Just for clarification • Atomic mass • amu, atomic mass units (uma??) • “Da” or Dalton. • kD (kiloDalton) • 1 amu = 1.66056*10-27 kg. • proton, mp = 1.67265*10-27 kg, • neutron, mn = 1.67495*10-27 kg.
Isotopic peaks • Mass spectrum of methane CH4 m/z =16 (12CH4) and m/z = 17 (13CH4) relative abundance = 99:1 • For a compound with 10 carbons (C10H18) The chance of incorporating one 13C into the molecule will be 10 times more. Therefore [M+1]+· would be 10 x1.08 = 10.8 percent of the abundance of [M]+· (see slide 5) • For a compound with 10 carbons, the approximate relative heights of the [M]+·, [M+1]+·, [M+2]+·, and [M+3]+· peaks are 100:10:0.45:0.01
(b) only one bromine atom (a) only one chlorine atom 1:1 3:1 3:4:1 c) one chlorine and one bromine atom
High Resolution Accurate Mass Measurement: Elemental Compositions • Accurate mass determination to several decimal places, using a double–focusing mass spectrometer, enables the determination of molecular formulae and elemental compositions • For an ion of NH3 , the measured integer mass would be 17, viz., m/z = 17/1 = 17, for z = 1. • In theory, this process can be reversed in that any measured mass leads to an elemental composition. • For example, a measured value of 17 would imply the composition, NH3 . • In practice, there are other elemental compositions which could add up to 17. For example, OH (oxygen = 16, hydrogen = 1), CD2H (carbon = 12, deuterium = 2*2, hydrogen = 1).
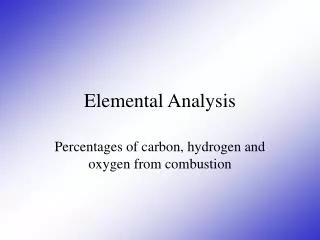
High Resolution Accurate Mass Measurement: Elemental Compositions • For larger masses, the possibilities increase enormously. • At mass 100, there would be literally thousands of possible elemental compositions unit mass is not enough! • In fact atomic masses are not integers! • C = 12.0000. • O = 15.9949, • N = 14.0031, • H = 1.0078 and so on… • The accurate mass for ammonia (NH3 ) is: 14.0031 + 3 x 1.0078 = 17.0265 • The accurate mass of OH is: 15.9949 + 1.0078 = 17.0027, • giving a mass difference of 0.0238 units between NH3 and OH, which are potentially separable. • A mass spectrometer which can measure mass correct to several decimal places rather than just integer mass can be used to measure such differences • RESOLUTION IS IMPORTANT ELEMENTAL ANALYSIS
Accurate Mass Determination m/z measured 58.04189 C3H6O
Exact masses and corresponding formulae for various possible ions of m/z 180 containing only carbon, hydrogen, nitrogen and oxygen atoms in limited number (C6-15, H0-24, N0-4, and O0-4)
Lets go back to resolution: what do I need to separate them? • The accurate mass for ammonia (NH3 ) is: 14.0031 + 3 x 1.0078 = 17.0265 • The accurate mass of OH is: 15.9949 + 1.0078 = 17.0027, • giving a mass difference of 0.0238 units between NH3 and OH, which are potentially separable. • Dm = 0.0238 amu • m= 17.0265 amu for NH3 • Minimum resolution required: • R = 17.0265/0.0238 = 715.4
(h/H)x100 ≤ 10 H h How good is good? 5000 resolution separate m/z 50.000 from m/z 50.010, m/z 100.00 from m/z 100.02, m/z 1000.0 from m/z 1000.2 m/z 10000 from m/z 10002 Unit resolution m/z 50 from m/z 51, m/z 100 from m/z 101, m/z 1000 from m/z 1001.
500 10000 Clenbuterol m/z 355
When resolution is not a good thing? Sensitivity vs. selectivity