Download
1 / 1
10 likes | 102 Views
Ny Alesund. Darwin. Park Falls. O 2 A-band. CO 2 2.06 m. CO 2 1.61 m. Algeria. Lauder. South Pacific. The Orbiting Carbon Observatory Mission: Fast Polarization Calculations Using the R-2OS Radiative Transfer Model

E N D
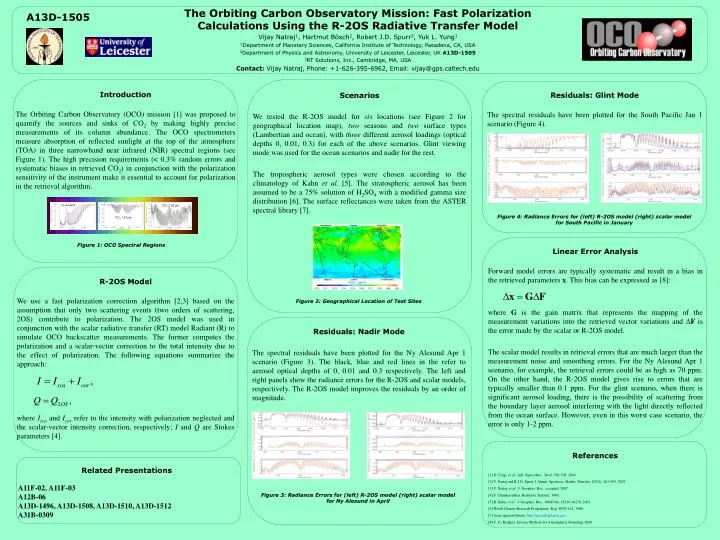
Ny Alesund Darwin Park Falls O2 A-band CO2 2.06 m CO2 1.61m Algeria Lauder South Pacific The Orbiting Carbon Observatory Mission: Fast Polarization Calculations Using the R-2OS Radiative Transfer Model Vijay Natraj1, Hartmut Bösch2, Robert J.D. Spurr3, Yuk L. Yung1 1Department of Planetary Sciences, California Institute of Technology, Pasadena, CA, USA 2Department of Physics and Astronomy, University of Leicester, Leicester, UK A13D-1505 3RT Solutions, Inc., Cambridge, MA, USA Contact: Vijay Natraj, Phone: +1-626-395-6962, Email: vijay@gps.caltech.edu A13D-1505 Introduction The Orbiting Carbon Observatory (OCO) mission [1] was proposed to quantify the sources and sinks of CO2 by making highly precise measurements of its column abundance. The OCO spectrometers measure absorption of reflected sunlight at the top of the atmosphere (TOA) in three narrowband near infrared (NIR) spectral regions (see Figure 1). The high precision requirements (< 0.3% random errors and systematic biases in retrieved CO2) in conjunction with the polarization sensitivity of the instrument make it essential to account for polarization in the retrieval algorithm. Residuals: Glint Mode The spectral residuals have been plotted for the South Pacific Jan 1 scenario (Figure 4). Scenarios We tested the R-2OS model for six locations (see Figure 2 for geographical location map), two seasons and two surface types (Lambertian and ocean), with three different aerosol loadings (optical depths 0, 0.01, 0.3) for each of the above scenarios. Glint viewing mode was used for the ocean scenarios and nadir for the rest. The tropospheric aerosol types were chosen according to the climatology of Kahn et al. [5]. The stratospheric aerosol has been assumed to be a 75% solution of H2SO4 with a modified gamma size distribution [6]. The surface reflectances were taken from the ASTER spectral library [7]. Figure 4: Radiance Errors for (left) R-2OS model (right) scalar model for South Pacific in January Linear Error Analysis Forward model errors are typically systematic and result in a bias in the retrieved parameters x. This bias can be expressed as [8]: where G is the gain matrix that represents the mapping of the measurement variations into the retrieved vector variations and ΔF is the error made by the scalar or R-2OS model. The scalar model results in retrieval errors that are much larger than the measurement noise and smoothing errors. For the Ny Alesund Apr 1 scenario, for example, the retrieval errors could be as high as 70 ppm. On the other hand, the R-2OS model gives rise to errors that are typically smaller than 0.1 ppm. For the glint scenario, when there is significant aerosol loading, there is the possibility of scattering from the boundary layer aerosol interfering with the light directly reflected from the ocean surface. However, even in this worst case scenario, the error is only 1-2 ppm. Figure 1: OCO Spectral Regions R-2OS Model We use a fast polarization correction algorithm [2,3] based on the assumption that only two scattering events (two orders of scattering, 2OS) contribute to polarization. The 2OS model was used in conjunction with the scalar radiative transfer (RT) model Radiant (R) to simulate OCO backscatter measurements. The former computes the polarization and a scalar-vector correction to the total intensity due to the effect of polarization. The following equations summarize the approach: where Iscaand Icorrefer to the intensity with polarization neglected and the scalar-vector intensity correction, respectively; I and Q are Stokes parameters [4]. Figure 2: Geographical Location of Test Sites Residuals: Nadir Mode The spectral residuals have been plotted for the Ny Alesund Apr 1 scenario (Figure 3). The black, blue and red lines in the refer to aerosol optical depths of 0, 0.01 and 0.3 respectively. The left and right panels show the radiance errors for the R-2OS and scalar models, respectively. The R-2OS model improves the residuals by an order of magnitude. References [1] D. Crisp, et al., Adv. Space Res., 34(4), 700-709, 2004. [2] V. Natraj and R.J.D. Spurr, J. Quant. Spectrosc. Radiat. Transfer, 107(2), 263-293, 2007. [3] V. Natraj, et al., J. Geophys. Res., accepted, 2007. [4] S. Chandrasekhar, Radiative Transfer, 1960. [5] R. Kahn, et al., J. Geophys. Res., 106(D16), 18219-18238, 2001. [6] World Climate Research Programme, Rep. WCP-112, 1986. [7] Aster spectral library: http://speclib.jpl.nasa.gov. [8] C. D. Rodgers, Inverse Methods for Atmospheric Sounding, 2000. Related Presentations A11F-02, A11F-03 A12B-06 A13D-1496, A13D-1508, A13D-1510, A13D-1512 A31B-0309 Figure 3: Radiance Errors for (left) R-2OS model (right) scalar model for Ny Alesund in April