Download
1 / 44
440 likes | 736 Views
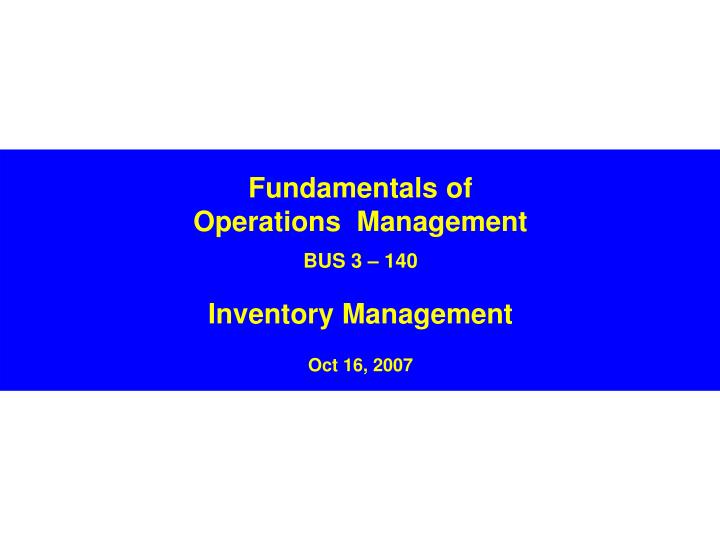
Fundamentals of Operations Management BUS 3 – 140 Inventory Management Oct 16, 2007. Master Scheduling. The Master Schedule “disaggregates ” the Aggregate Plan. Figure 13.4. Figure 13.5. Aggregate Planning. Aggregate Plan. Jan. Feb. Mar. Lawn Mowers. 200. 300. 400. Disaggregation.

E N D
Fundamentals ofOperations ManagementBUS 3 – 140Inventory ManagementOct 16, 2007
The Master Schedule “disaggregates ” the Aggregate Plan Figure 13.4 Figure 13.5 Aggregate Planning Aggregate Plan Jan Feb Mar Lawn Mowers 200 300 400 Disaggregation Master Schedule Jan Feb Mar Push Mowers 100 100 100 Power Mowers 75 150 200 Riding Mowers 25 50 100 Total 200 300 400 Master Schedule * From Stevenson, Operations Management, Ninth Edition, McGraw Hill Irwin
The Master Scheduling Process (Figure 13.6) Outputs Inputs • Beginning Inventory • Forecast • Orders • Projected Inventory • Master Production Schedule • Uncommitted Inventory PROCESS * From Stevenson, Operations Management, Ninth Edition, McGraw Hill Irwin
Additional Key Points in Master Scheduling • Rough Cut Capacity Planning • Time Horizons • Time Fences • “Available to Promise” The most valuable part of the job is knowing when to say, “Yes” and when to say, “No”
Time Fences “frozen”(firm orfixed) “liquid”(open) “slushy”somewhatfirm Only Executive Exception would authorize a Change Only Executive Exception would NOT authorize a Change Changes are likely to be accepted, but require Research and / or Business Case
Time Fences can be Dynamic Typical Technology Manufacturer Dell Computer Cargo Airplanes for the US Dept. of Defense Restaurant Burger King • Generally varies by Lead Time to obtain Materials and Capital equipment • Goal is to minimize the Red and Yellow and keep FLEXIBILITY and RESPONSIVENESS to a maximum
Assembly Subassembly Fabrication Procurement 6 7 1 2 3 4 5 8 9 10 Planning Horizon Figure 14.4 Time Period (weeks)
Sales & Operations PlanningA bridge between Aggregate Planning & Master Scheduling
Sales & Operations Planning (S&OP) Purpose • Senior Management Alignment on Revenue and Supply plans • Greater accountability of individual plans • Consensus on managing gaps Output • Judged Revenue Plan • Master Build Schedule • Contingency plans • Documented agreements and planned outcomes
Key S&OP Inputs, by Function • Unconstrained Forecast • Execution to Plan • Capacity • Materials Plan • Time to Volume • Buffer Targets Sales Operations BU’s Finance • Prelim. Revenue Plan • GM Revenue objectives • Profitability scenarios • Prelim. Budgets • Prelim. FGI Targets • Return on Invested Capital • Market Trends & TAM • Share expectations • Customer TAM expectations • Roadmaps and Transitions
S&OP Output is a Consensus Plan • Constrained Revenue plan • Accountability for Forecast Accuracy • Standard, system-generated, accuracy metrics • Defined ownership by Sales and Marketing • Joint ownership of FGI between Sales and Operations • MPS tied to single plan of record and business rules • Published Lead Times • Integrated Revenue plan • Credible EPS guidance • Exception Loops between meetings
Reasons for Carrying Inventory • Revenue • Have what Customers want, when they want it • Compensate for non-linear demand that doesn’t match your capacity • Buffer for upside demand • Buffer for when competitors cannot deliver • Buffer against unexpected internal supply problems Carrying Buffer inventory is necessary, but continuous, relentless efforts to minimize variability, and thus eliminate the need for the Buffers is greatly preferred
Reasons for Carrying Inventory • Cost and Efficiency • Minimize shortages, to avoid delays and idle time • Optimize plant, people, and equipment utilization • Obtain volume discounts for favorable unit pricing • Hedge against future price increases Optimizing utilization and unit pricing are valuable only when the goods made or purchased will SOLD to a paying Customer in a reasonable time The cost of a STOCKOUT is hard to quantify, but is to be AVOIDED at all times
Inventory Turns Inventory turnover is the ratio ofaverage cost of goods sold toaverage inventory investment.
Types of Inventory Maintenance, Repair, & Operating Supplies (MRO) Raw Materials Resale Items Work In Process (WIP) Finished Goods (FGI) Manufacturing All Independent Demand Chocolate Cake Finished Goods Cake Icing Subassembly (WIP) Raw Material Dependent Demand Water Egg Mix MRO Raw
Costs of Inventory • Carrying Costs • Capital (Interest and Opportunity Costs) • Warehouses and Stock rooms • Personnel • Insurance • Damage and Loss • Theft • Insurance • Taxes • Other Costs • Ordering Costs • Setup Costs • Stockout Costs • Lost Sales • Idle labor and equipment • Expedite fees
A system to keep track of inventory A reliable forecast of demand Knowledge of Lead Times Reasonable estimates of Holding costs Ordering costs Shortage costs A classification system Prerequisites for Inventory Mgmt
Lead Time Production Transit Receipt Planning Ordering Materials Set up Production Packaging Will be addressed directly in Later Chapters
A physical count of items in inventory Cycle counting management How much accuracy is needed? When should cycle counting be performed? Who should do it? Cycle Counting
Triggers for Cycle Counting • Out-Of-Stock report • Zero balance • Discrepancy • ABC report
ABC Classification – the 80/20 Rule Applied * From Leenders, Johnson, Flynn, and Fearon, Purchasing and Supply Management, Thirteenth Edition, McGraw Hill Irwin
ABC Classification is not based on unit cost Unit Cost Annual Volume Annual Spend A High High High A High Medium High A Medium High High A Low Very High High B High Low Medium B Medium Medium Medium B Low High Medium C Medium Low Low C Low Medium Low C Low Low Low C Items can still stop a production line and cause Customer Shipments to be missed!
The Economic Order Quantity (EOQ) and other Lot Sizing approaches
Only one product is involved Annual demand requirements known Demand is even throughout the year Lead time does not vary Each order is received in a single delivery There are no quantity discounts Assumptions of EOQ Model
Lot Sizing: The Economic Order Quantity (EOQ) CTmin total cost Annual Cost ($) carrying costs ordering costs EOQ Quantity Ordered A conceptual model that balances Carrying Costs and Ordering Costs. Somewhat limited, but often useful for C Items * From Leenders, Johnson, Flynn, and Fearon, Purchasing and Supply Management, Thirteenth Edition, McGraw Hill Irwin
Lot Sizing: Order Quantities • Fixed Quantity • Same quantity whenever material is needed • Fixed Period • Calculates requirements for n periods. Example = 4 periods • E O Q • Calculated to balance Inventory & Ordering Costs • Supplier Multiple • Similar to Fixed • Lot-For-Lot • Maps exactly to Requirements
Example of how Inventory is Consumed and Reordered INVENTORY cycle stock ROP ROP = L × d TIME lead time (L) * From Leenders, Johnson, Flynn, and Fearon, Purchasing and Supply Management, Thirteenth Edition, McGraw Hill Irwin
MRP Inputs MRP Processing MRP Outputs Changes Order releases Master schedule Planned-order schedules Primary reports Exception reports Bill of materials Planning reports MRP computer programs Secondary reports Performance- control reports Inventory records Inventory transaction MRP Overview Figure 14.2 * From Stevenson, Operations Management, Ninth Edition, McGraw Hill Irwin
Low levels of in-process inventories Ability to track material requirements Ability to evaluate capacity requirements Means of allocating production time Ability to easily determine inventory usage by backflushing Backflushing: Exploding an end item’s bill of materials to determine the quantities of the components that were used to make the item. Benefits of MRP
Computer and necessary software Accurate and up-to-date Master schedules Bills of materials Inventory records Lead Times Other Requirements of MRP
Highest Level MRP Logic Business Terms: Product Planning Demand Planning Master Production Scheduling Material Planning Production Delivery & Service Life Terms: Will have Italian Food Dinner on Saturday Menu Recipes & Ingredients Cooking Eating!
MRP Logic is Constantly Balancing Supply & Demand What you NEED (Demand) What you HAVE (Supply) • Final Assemblies • Sales Orders • Forecast • Components and Subassemblies: • Higher level Starts • Higher level Work Order Shortages • Stockroom Inventory • WIP Stores Inventory • Open Work Orders • Open Purchase Orders What you NEED TO GET and WHEN you need to get it (MRP output) • Planned Purchase Orders • Planned Work Orders • Rescheduled Work Orders • Rescheduled Purchase Orders
Item/Descr. Where Used QPA OH LT Past Due 31-Jan 7-Feb 14-Feb 21-Feb 28-Feb SJSU141 MB1234 1 0 1 Gross Requirement 0 50 50 70 100 40 Mother Board On Order 0 70 100 10 0 0 Projected Available 0 20 70 10 -90 -130 Planned Order Complete 0 0 0 0 90 40 Planned Order Starts 0 0 0 90 40 0 Cum Planned Order 0 0 0 0 90 130 MRP “Nets” Inventory Balance On Hand just like a Checkbook is Equivalent to:
Item/Descr. Where Used QPA OH LT Past Due 31-Jan 7-Feb 14-Feb 21-Feb 28-Feb SJSU141 MB1234 1 0 1 Gross Requirement 0 50 50 70 100 40 Mother Board On Order 0 70 100 10 0 0 Projected Available 0 20 70 10 -90 -130 Planned Order Complete 0 0 0 0 90 40 Planned Order Starts 0 0 0 90 40 0 Cum Planned Order 0 0 0 0 90 130 MRP Netting Logic Illustration Lead Time Quantity Per Assembly Quantity On Hand
MRP is EXTREMELY DEPENDENT on ACCURATE DATA The system MUST see ALL inventory in ALL of these categories at ALL times In WIP Open Work Orders Open Purchase Orders In Receiving In the Stockroom In a higher Assemblies In Finished Goods Shipped In a WIP Location EVERY time inventory is moved, a TRANSACTION must be executed
Food catering service End item => catered food Dependent demand => ingredients for each recipe, i.e. bill of materials Hotel renovation Activities and materials “exploded” into component parts for cost estimation and scheduling MRP in Services
Expanded MRP with emphasis placed on integration Financial planning Marketing Engineering Purchasing Manufacturing MRP II
Master production schedule Market Demand Finance Manufacturing Marketing Production plan MRP Adjust master schedule Rough-cut capacity planning Capacity planning Adjust production plan No Yes Requirements schedules No Yes Problems? Problems? ERP Overview Figure 14.14 * From Stevenson, Operations Management, Ninth Edition, McGraw Hill Irwin
Enterprise resource planning (ERP): Next step in an evolution that began with MPR and evolved into MRPII Integration of financial, manufacturing, and human resources on a single computer system. ERP