Download
1 / 8
80 likes | 87 Views
This module provides guidance on reporting REDD+ performance using IPCC guidelines and examples from Annex 1 countries. It covers GHG inventory reporting, conservativeness approach, and matrix approach. Examples of CRF tables for LULUCF under the Kyoto Protocol are also included.

E N D
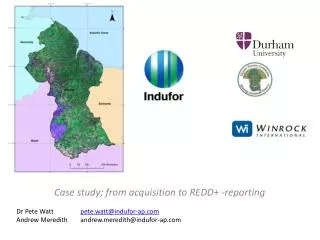
Module 3.3 Guidance on reporting REDD+ performance using IPCC guidelines and guidance Module developer: Giacomo Grassi, European Commission – Joint Research Centre Country examples: • Annex 1 country example of GHG inventory reporting (LULUCF) • Appling the conservativeness approach to the DRC example (matrix approach)– See module 2.7 V1, May 2015 Creative Commons License
1. CRF tables of Annex 1 The greenhouse gas inventory (GHGI) of an Annex I country is composed of two distinct documents: • Common reporting format (CRF) tables, which contain a time-series of GHG emission estimates (from 1990 until the year x-2, where x is the submission year of the GHGI) • National inventory report (NIR), which includes all information on background data and methods used and the institutional arrangements underlying the preparation of the GHGI. • The GHG inventory is submitted annually and reviewed Next slides: examples of selected CRF tables for LULUCF under the Kyoto Protocol (KP)
Cells in diagonal: those lands that where subject to the same category in the reporting year and also in the previous year Other cells: area subject to land use change in the inventor year Land transition matrix
Sectoral background table for C stock changes resulting from Deforestation Subdivision up to Party: type/year of conversion, climate zone, management system, soil type, vegetation type, national land classification, etc.
2. Appling the conservativeness approach to the DRC example (matrix approach) This country example is in common with country example 3 in Module 2.7 See country example included in Module 2.7
References • IPCC (Intergovernmental Panel on Climate Change). 2000. Good Practice Guidance and Uncertainty Management in National Greenhouse Gas Inventories. (Often IPCC GPG.) Geneva, Switzerland: IPCC. http://www.ipcc-nggip.iges.or.jp/public/gp/english/. • UNFCCC (United Nations Framework Convention on Climate Change.) n.d.a. “National Inventory Submissions 2013.” http://unfccc.int/national_reports/annex_i_ghg_inventories/national_inventories_submissions/items/7383.php. • UNFCCC. n.d.b. “Inventory Review Reports 2012.” http://unfccc.int/national_reports/annex_i_ghg_inventories/inventory_review_reports/items/6616.php.