Download
1 / 31
310 likes | 570 Views
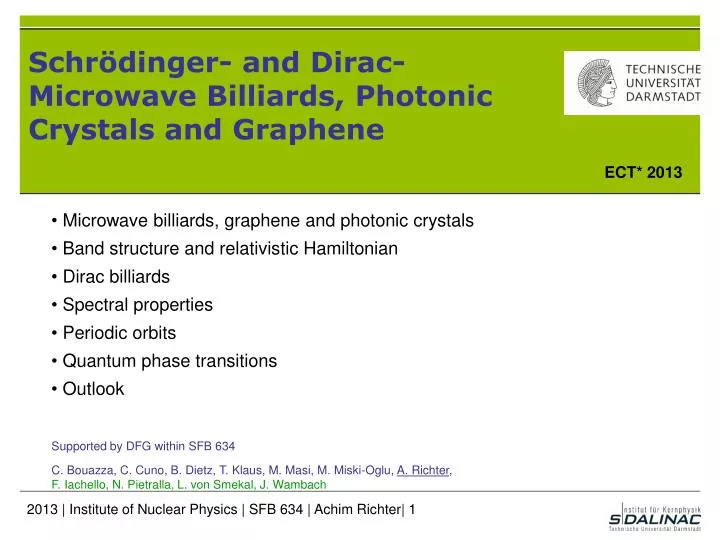
Schrödinger- and Dirac-Microwave Billiards, Photonic Crystals and Graphene. ECT* 2013. Microwave billiards, graphene and photonic crystals Band structure and relativistic Hamiltonian Dirac billiards Spectral properties Periodic orbits Quantum phase transitions Outlook.

E N D
Schrödinger- and Dirac-Microwave Billiards, Photonic Crystals and Graphene ECT* 2013 • Microwave billiards, graphene and photonic crystals • Band structure and relativistic Hamiltonian • Dirac billiards • Spectral properties • Periodic orbits • Quantum phase transitions • Outlook Supported by DFG within SFB 634 C. Bouazza, C. Cuno, B. Dietz, T. Klaus, M. Masi, M. Miski-Oglu, A. Richter, F. Iachello, N. Pietralla, L. von Smekal, J. Wambach
Quantum billiard Microwave billiard d eigenvalue Ewave number Schrödinger- and Microwave Billiards Analogy eigenfunction Y electric field strength Ez
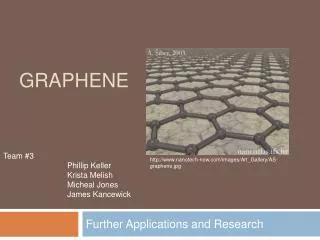
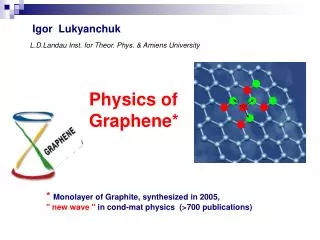
Graphene • “What makes graphene so attractive for research is that the spectrum closely resembles the Dirac spectrum for massless fermions.”M. Katsnelson, Materials Today, 2007 • Two triangular sublattices of carbon atoms • Near each corner of the first hexagonal Brillouin zone the electron energy Ehas a conical dependence on the quasimomentum • but low • Experimental realization of graphene in analog experiments of microwave photonic crystals conduction band valence band
Open Flat Microwave Billiard:Photonic Crystal • A photonic crystal is a structure, whose electromagnetic properties vary periodically in space, e.g. an array of metallic cylinders→ open microwave resonator • Flat “crystal” (resonator) → E-field is perpendicular to the plates (TM0 mode) • Propagating modes are solutions of the scalar Helmholtz equation → Schrödinger equation for a quantum multiple-scattering problem→ Numerical solution yields the band structure
conduction band valence band Calculated Photonic Band Structure • Dispersion relation of a photonic crystal exhibits a band structure analogous to the electronic band structure in a solid • The triangular photonic crystal possesses a conical dispersion relationDirac spectrum with a Dirac point where bands touch each other • The voids form a honeycomb lattice like atoms in graphene
Effective Hamiltonian around Dirac Point • Close to Dirac point the effective Hamiltonian is a 2x2 matrix • Substitution and leads to the Dirac equation • Experimental observationof a Dirac spectrum in an open photoniccrystalS. Bittner et al., PRB 82, 014301 (2010)
Reflection Spectrum of an Open Photonic Crystal • Measurement with a wire antennaaput through a drilling in the top plate → point like field probe • Characteristic cusp structure around the Dirac frequency • Van Hove singularities at the band saddle point • Next: experimental realization of a relativistic (Dirac) billiard
Microwave Dirac Billiard: Photonic Crystal in a Box→ “Artificial Graphene“ • Graphene flake: the electron cannot escape → Dirac billiard • Photonic crystal: electromagnetic waves can escape from it → microwave Dirac billiard: “Artificial Graphene“ • Relativistic massless spin-one half particles in a billiard (Berry and Mondragon,1987) Armchair edge Zigzag edge
Superconducting Dirac Billiard with Translational Symmetry • The Dirac billiard is milled out of a brass plate and lead plated • 888 cylinders • Height h=3 mm fmax = 50 GHz for 2D system • Lead coating is superconducting below Tc=7.2 K high Q value • Boundary does not violate the translational symmetry no edge states
Transmission Spectrum at 4 K • Measured S-matrix: |S21|2=P2 / P1 • Pronounced stop bands and Dirac points • Quality factors > 5∙105 • Altogether 5000 resonancesobserved
Density of States of the Measured Spectrum and the Band Structure Positions of stop bands are in agreement with calculation DOS related to slope of a band Dips correspond to Dirac points High DOS at van Hove singularities ESQPT? Flat band has very high DOS Qualitatively in good agreement with prediction for graphene(Castro Neto et al., RMP 81,109 (2009)) Oscillations around the mean density finite size effect stop band Dirac point stop band Dirac point stop band
Tight-Binding Model (TBM) for ExperimentalDensity of States (DOS) • Level density • Dirac point • Van Hove singularities of the bulk states at • Next: TBM description of experimental DOS
determined from experiment TBM Description of the Photonic Crystal • The voids in a photonic crystal form a honeycomb lattice • resonance frequency of an “isolated“ void • nearest neighbour contribution t1 • next-nearest neighbour contribution t2 • second-nearest neighbour contribution t3 • Here the overlap is neglected t3 t2 t1
Fit of the TBM to Experiment • Good agreement • Fluctuation properties of spectra
Schrödinger and Dirac Dispersion Relation in the Photonic Crystal Dirac regime Schrödinger regime • Dispersion relationalongirreducibleBrillouinzone • Quadraticdispersionaroundthe point Schrödingerregime • Linear dispersionaroundthe point Dirac regime
Integrated Density of States Dirac regime Schrödinger regime • Schrödinger regime: • Dirac Regime: (J. Wurm et al., PRB 84, 075468 (2011)) • Fit of Weyl’s formula to the data and
Spectral Properties of a Rectangular Dirac Billiard: Nearest Neighbour Spacing Distribution Spacing between adjacent levels depends on DOS Unfolding procedure: such that 130 levels in the Schrödinger regime 159 levels in the Dirac regime Spectral properties around the Van Hove singularities?
Ratio Distribution of Adjacent Spacings • DOS is unknown around Van Hove singularities • Ratio of two consecutive spacings • Ratios are independent of the DOS no unfolding necessary • Analytical prediction for Gaussian RMT ensembles (Y.Y. Atas, E. Bogomolny, O. Giraud and G. Roux, PRL, 110, 084101 (2013) )
Ratio Distributions for Dirac Billiard • Poisson: ; GOE: • Poisson statistics in the Schrödinger and Dirac regime • GOE statistics to the left of first Van Hove singularity • Origin ? ; e.m. waves “see the scatterers“
Periodic Orbit Theory (POT) Gutzwiller‘s Trace Formula • Description of quantum spectra in terms of classical periodic orbits wave numbers spectrum length spectrum spectral density FT Peaks atthelengthslof PO’s Dirac billiard Periodicorbits Effective description S: D:
Experimental Length Spectrum: Schrödinger Regime • Effective description ( ) has a relative error of 5% at the frequency of the highest eigenvalue in the regime • Very good agreement • Next: Dirac regime
Experimental Length Spectrum: Dirac Regime upper Dirac cone (f>fD) lower Dirac cone (f<fD) • Some peak positions deviate from the lengths of POs • Comparison with semiclassical predictions for a Dirac billiard(J. Wurm et al., PRB 84, 075468 (2011)) • Effective description ( ) has a relative error of 20% at the frequency of the highest eigenvalue in the regime
Summary I Measured the DOS in a superconducting Dirac billiard with high resolution Observation of two Dirac points and associated Van Hove singularities:qualitative agreement with the band structure for graphene Description of the experimental DOS with a tight-binding model yields perfect agreement Fluctuation properties of the spectrum agree with Poisson statistics both in the Schrödinger and the Dirac regime, but not around the Van Hove singularities Evaluated the length spectra of periodic orbits around and away from the Dirac point and made a comparison with semiclassical predictions Next: Do we see quantum phase transitions?
saddle point saddle point Experimental DOS and Topology of Band Structure • Each frequency f in the experimental DOS r ( f ) is related to an isofrequency line of band structure in k space • Close to band gaps isofrequency linesform circles around G point • Sharp peaks at Van Hove singularities correspond to saddle points • Parabolically shaped surface merges into Dirac cones around Dirac frequency → topological phase transition from non-relativistic to relativistic regime r ( f )
Neck-Disrupting Lifshitz Transition • Gradually lift Fermi surface across saddle point, e.g., with a chemical potential m → topology of the Fermi surface changes • Disruption of the “neck“ of the Fermi surface at the saddle point • At Van Hove singularities DOS diverges logarithmically in infinite 2D systems → Neck-disrupting Lifshitz transition with m as a control parameter (Lifshitz 1960) topologicaltransition in twodimensions
Finite-Size Scaling of DOS at the Van Hove Singularities • TBM forinfinitely large crystalyields • Logarithmicbehaviourasseen in bosonicsystems - transversevibrationof a hexagonal lattice(Hobsonand Nierenberg, 1952) - vibrations of molecules (Pèrez-Bernal, Iachello, 2008) - two-level fermionic and bosonic pairing models (Caprio, Scrabacz, Iachello, 2011) • Finite sizephotoniccrystalsorgrapheneflakesformedbyhexagons , i.e. logarithmicscalingofthe VH peak determinedusing Dirac billiardsofvaryingsize:
with and the nearest-neighbor vectors Particle-Hole Polarization Function: Lindhard Function • Polarization in one loop calculated from bubble diagram → Lindhard function at zero temperature • Use TBM taking into account only nearest-neighbor hopping • Overlap of wave functions for intraband (=l’) and interband (λ=-l’) transitions within, respectively, between cones
q Static Susceptibility and Spectral Distribution of Particle-Hole Excitations I • Static susceptibility at zero-momentum transfer • Nonvanishing contributions only from real part of Lindhard function • Divergence of at m = 1 caused by the infinite degeneracy of ground states when Fermi surface passes through Van Hove singularities →GSQPT • Imaginary part of Lindhard function at zero-momentum transfer yields for spectral distribution of particle-hole excitations • Only interband contributions and excitations for w > 2m (Pauli blocking) • Same logarithmic behavior observed for ground and excited states → ESQPT
Static Susceptibility and Spectral Distribution of Particle-Hole Excitations II • Sharp peaks of at m=1, w=0 and for -1≤ ≤ 1, w=2 clearly visible • Experimental DOS can be quantitatively related to GSQPT and ESQPT arising from a topological Lifshitz neck-disrupting phase transition • Logarithmic singularities separate the relativistic excitations from the nonrelativistic ones Schrödinger regime Dirac regime
f-Sum Rule as Quasi-Order Parameter • Transition due to change of topology of Fermi surface → no order parameter • Normalization is fixed due to charge conservation via f - sum rule Z=Z++Z- Z- Z+ • Z const. in the relativistic regime < 1 • At = 1 its derivative diverges logarithmically • Zdecreases approximately linearly in non-relativistic regime > 1
Outlook • ”Artificial” Fullerene • Understanding of the measured spectrum in terms of TBM • Superconducting quantum graphs • Test of quantum chaotic scattering predictions(Pluhař + Weidenmüller 2013) 200 mm 50 mm