Download
1 / 266
2.66k likes | 2.67k Views
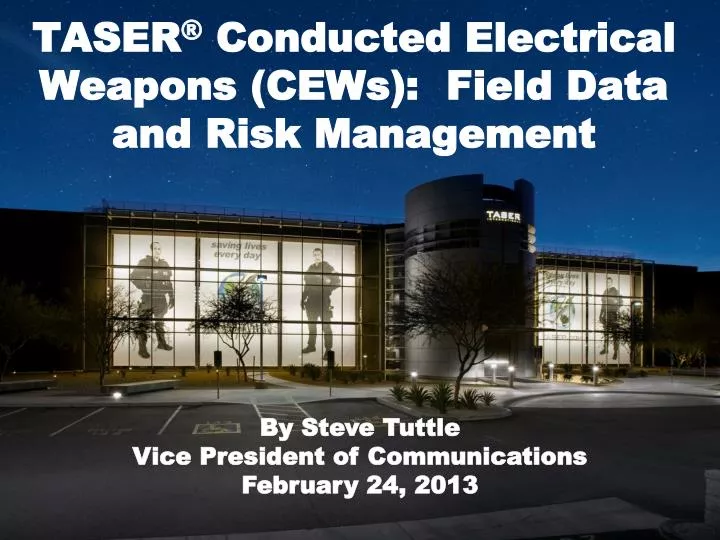
TASER ® Conducted Electrical Weapons (CEWs ): Field Data and Risk Management. By Steve Tuttle Vice President of Communications February 24, 2013. Risk Management Summary. Why TASER?. May reduce use of deadly force May reduce injuries to suspects

E N D
TASER®Conducted Electrical Weapons (CEWs): Field Data and Risk Management By Steve Tuttle Vice President of Communications February 24, 2013
Why TASER? • May reduce use of deadly force • May reduce injuries to suspects • May reduce injuries to officers by suspects • May reduce litigation by injured suspects SOURCE: The Police Policies Studies Council http://www.theppsc.org/Staff_Views/Czarnecki/Taser.Recommendations.htm presented at the IACP Annual Conference in 2005 by Fabrice Czarnecki, MD, MA, MPH
TASER CEW Stats • TASER International has sold approximately 710,000 TASER®CEWs in 103 countries • More than 16,900 law enforcement, private security, and military agencies deploy TASER CEWs • More than 255,000 TASER brand CEWs have been sold to the general public
TASER CEW Usage Stats Field Use as of February 11, 2013 Volunteers as of December 31, 2011 • Field Use/Suspect Applications: 1,820,500 ±2% • Training/Voluntary Applications: 1,351,891 ± 7% • Total: 3.17 million+
TASER Saving Lives as of February 20, 2013 The "Saves Counter" tracks estimates of the number of people whose lives have been saved from potential death or serious injury using TASER® devices. The Saves Counter is posted on the home page of TASER.com
TASER Saving Lives as of August 24, 2012 103,324 Lives Saved Would Outsell the Rose Bowl
“The last time you deployed a less-lethal weapon, it was a ...”Police One Feb 2010 Poll “Suspect Injuries Reduced by 60% When Less-lethal Weapons are Deployed” Source: DOJ Report
TASER: Most Used Force OptionNIJ Study: Florida Gulf Coast University
Michigan Municipal Risk Management Authority (MMRMA)Claims for Excessive Use of Force • MMRMA represents 149 law enforcement agencies in Michigan • Approximately 6,000 officers are employed by those agencies
MMRMALosses For Excessive Force Claims TASERIntroduced: May 2003 Excessive Force Claims Down 95% • MMRMA represents 149 law enforcement agencies in Michigan • Approximately 6,000 officers are employed by those agencies
Worker’s Comp Savings Paid for The Entire Houston PD TASER Deployment and Generated About a Million Dollar Surplus TASER Program Introduced Workman’s Compensation Claims Down 93% Source: Houston PD
TASER Devices Reduce Injuries Injuries Per 1,000 Exposures Firearm Baton Strike Punch Kick NCAA Basketball TASER
The Need for CEWs • 53,469 officers were assaulted in 2010 • Nearly 14,000 officers, or 26.1 percent of those assaulted, were injured in 2010 • Assailants used • personal weapons (hands, fists, feet, etc.) in 81.8 percent of the incidents: 43,731. An officer is 45 times more likely to be assaulted by an unarmed suspect than an armed suspect • firearms in 3.4 percent of incidents • knives or other cutting instruments in 1.7 percent of the incidents. • Other types of dangerous weapons were used in 13.1 percent of assaults Source: FBI’s “Law Enforcement Officers Killed and Assaulted, 2010”. (October 2011)
Wake Forest Univ./DOJ Study The study found that the use of TASER CEWs are “remarkably safe” compared with bludgeoning weapons or hand-to-hand combat, said Dr. William Bozeman
Of 2026 consecutive ECC uses, 100 (4.9%) were uses against minor suspects ranging from 13 to 17 years, with a mean age of 16.1 years. No significant (moderate or severe) injuries were reported (0%). 20 suspects (20%) sustained 34 mild injuries the majority of these injuries (67.6%) were expected superficial punctures from CEW probes. Other mild injuries included superficial abrasions and contusions in 7 cases (7%). TASER CEW Use Against Minors: A Shocking Analysis
Conclusions: None of the minor suspects studied sustained significant injury, and only 20% reported minor injuries, mostly from the expected probe puncture sites. These data suggest that adolescents are not at a substantially higher risk than adults for serious injuries after CEW use. TASER CEW Use Against Minors: A Shocking Analysis
Unmatched Safety & Technology 450+ Safety Studies, Abstracts, Reports, Letters, etc. (More Than Any Other Force Option) 77% Independent of TASER 117 Patents Select samples of Institutions that have published research on TASER CEWs:
70% 40% Fewer Officer Injuries Use of ECWs was associated with a 70% reduction in the chances of an officer being injured compared to agencies that do not use ECWs. Fewer SuspectInjuries The odds of a suspect being injured were reduced by more than 40% in ECW agencies compared to non-ECW agencies.
“CED use is associated with a significantly lower risk of injury than physical force, so it should be considered as an alternative in situations that would otherwise result in the application of physical force.” • “The risks of cardiac arrhythmias or death remain low and make CEDs more favorable than other weapons.”
Despite a 14% increase in arrests and a 125% jump in arrests for weapons 2012, officer assaults dropped 25 percent “I absolutely attribute this to Tasers,” Acting OCPD Chief Kevin Kirstein told the Town Council. “That TASER comes out, and it’s just like you see on YouTube — ‘Don’t tase me bro!’ The hands go up, they quit fighting, and that’s the end of that.” Ocean City PD MDOfficer Assaults Down 25% in 2012
Acting Chief Kirstein said he wants 22 more TASER CEWs to outfit the rest of the officers on patrol. Not only is it helping police officers, but Kirstein said offender injuries have also decreased since the department rolled out TASER CEWs one year ago. Ocean City PD MDSuspect Injuries Down in 2012
Fort Worth PD has 1,500 sworn officers with more than 1,200 TASER X26 CEWs on hand with 250 TASER X2 CEWs purchased in March 2012. According to Fort Worth police figures, TASER X26 CEWs were used 1,841 times by officers between 2005-2010, and in two-thirds of the incidents where someone was arrested, they were used with minorities. Fort Worth PD TXTASER CEW Uses 2005-2010
TASER X26 CEW Total Uses: 1,841 African-Americans arrested after use: 824 (45%) Anglos arrested after use: 539 (29%) Hispanics arrested after use: 398 (22%) CEW use incidents precipitated by fights: 613 (34%) Traffic-related CEW use incidents: 269 (14%) Alcohol- or drug-related incidents: 228 (12%) CEW use incidents precipitated by mental illness or suicide calls: 152 (8%) Fort Worth PD TXTASER CEW Uses 2005-2010
Incidents precipitated by violent-crime calls: 49 Incidents related to warrant or investigation calls, dog-related incidents, and other reasons: 513 386 (21%) of those arrested were taken to a hospital. 209 of those arrested were admitted to a hospital for a mental evaluation. (11%) 606 (33%) of those arrested after an CEW use were found to be under the influence of alcohol. 331 (18%) of those arrested after an CEW use were under the influence of narcotics. Fort Worth PD TXTASER CEW Uses 2005-2010
Year # Arrested # Uses of Force As % of Total Arrests 2008 84,452 442 0.52% 2009 86,403 540 0.62% 2010 68,271 410 0.60% New Orleans PD LAArrest Totals vs Use Of Force Incidents
New Orleans PD LAOfficers Injured During Use of Force Incidents Decrease 2008 injured officers 64 2009 injured officers 26 (59% ▼) 2010 injured officers 6 (77% ▼) 29% 90% Overall
New Orleans PD LA Types of Officer Injuries for NOPD • Lacerations • Abrasions • Contusions • Fractures • Knee, Back and Shoulder Injuries • Bite Wounds • Chipped Teeth • Secondary Exposure to OC Spray • Gunshot Wounds
New Orleans PD LA Excessive Use Of Force Complaints 2008 complaints 169 2009 complaints 129 (24% ▼) 2010 complaints 124 (4% ▼) 27% Overall
New Orleans PD LA Use of Force Changes 2008 2009 2010 Take Downs 114 87 22 81%▼ Come Along 9 9 1 89%▼ Hands 157 220 84 46%▼ Feet 1 2 0 100%▼ Pressure Point 1 0 0 100%▼ Other 6 11 2 67%▼ Pepper Spray OC 68 22 3 97%▼ TASER CEW 79 286 291 268% ▲ ASP Baton 21 13 1 95%▼ PR-24 Baton 1 0 0 100%▼ Canine 63 22 5 92%▼ Gun Discharges 36 12 13 64%▼
12/08 – 12/12 BART PD Deployed TASER CEWs 78 times. None of the arrestees required hospitalization No officers injured during arrests when TASER CEWs were a factor. No Workers Comp reports and time lost due to injuries from making those arrests. Bay Area Rapid Transit PD CATASER Uses 2008 - 2012 Officer Injuries Suspect Injuries Workers Comp 0 0 0
“It has been statistically proven that the use of the TASER widespread has decreased the amount of injury to the number of suspects and officers, ” said Sgt. Jason Cullum In 2011, there were 73 TASER CEW uses versus 60 in 2010, cited largely to the fact more officers were issued CEWs. There were 587 total cases since 2004, the year TASER-use went department wide. None of the 587 cases resulted in serious injury or death Of 7,689 total arrests in 2011 only 4.6% (352) involved use of force which includes force by firearm, straight stick, K9, PepperBall, TASER X26 CEW, OC spray or physical force. Evansville PD INTASER Uses 2010-2011
Baton strike use has plummeted in recent years: In 2004, 59 cases involved impact devices There were only 2 baton cases in 2011 “If you hit somebody with a night stick, you’re going to injure them. There’s no doubt about it. There’s going to be side effects to that impact for several days. The TASER is designed to be used in the 5 second cycle. When that cycle is over, the effects of the TASER are over,” said Sgt Cullum. Evansville PD INTASER X26 vs Batons Uses in 2011 96%
CEW Usage YearUsage 2010……………..60 2009……………..57 2008….………….69 2007……………..65 2006……………..73 2005……………121 2004……………..69 2003………………3 Evansville PD INLevels of TASER Use of Force 2010
Use of ForceTimes Used Firearm1 (used as impact weapon) Straight Stick 5 K9 39 Pepperball 1 TASER X26 CEW 60 OC Spray 17 Hands, Fist, Feet 238 Total: 361 Evansville PD INLevels of Force 2010
Inmate assaults on deputies are down 52 percent from the 3months before their use began Staff injuries from inmates have dropped 64 percent Total use-of-force reports have fallen 28 percent Richmond Co Sheriff’s GA 2012 Inmate & Staff Injuries & Use of Force Down Inmate Assaults Staff Injuries Use of Force 52% 64% 64%
“We’ve had plenty of deputies get hurt and be out of work for a couple of weeks or more,” said Capt. Bill Reeves. “They get broken fingers, hurt wrists, sprained ankles – all kinds of stuff.” “It used to be that if an inmate didn’t cooperate, you would have to put your hands on them and that would end up in a fight. Now we let them know if they don’t follow directions they will be tased.” Richmond Co Sheriff’s GA TASER Cuts Inmate & Staff Injuries & Use of Force
Risk Management DetailsSource statistics are in the View Notes Pages Section of the PowerPoint
Suspect Injuries 2004 Phoenix PD AZFirst Top-10 City to Deploy to All Patrol Officers 67%
Deputy Injuries Ventura Co Sheriff’s Dept CA2007 First Year Field TASER CEW Results 72% • Deputies used the TASER CEW 123 times in 2007 • A 72 percent reduction in injuries to deputies showed in 2007 for the first full year in which VCSO deployed TASER CEWs when compared to the average annual number of injuries for 2003, 2004 and 2005.
St Louis Co Police MO Suspect and Officer Injuries 2003-2009 20% 37% • Since 2004, TASER CEWs were used about 110 times a year resulting in a 20 percent drop in injuries to suspects and a 37 percent drop in officer-related injuries.
St Louis Co Police MO Officer and Suspect Injuries 2003-2009
Use of TASER CEWs 2010 Milwaukee PD WI Complaints 40% 21% • From 2009 to 2010, CEW usage increased 40% from 65 to 91 and is the most used force tool yet the rate of complaints dropped significantly from 6.1% to 4.3%. • In 2009, 65 incidents (14%) involved the use of an CEW while 91 incidents involved CEWs in 2010. • Use of force incidents that occurred in 2010, 22 (4.3%) resulted in a formal compared to 28 complaints (6.1%) in 2009.
Suspect Injuries 2007-2009 Pocatello PD IDIntroduction of TASER with Steady Increase of Usage 51%