Download
1 / 21
320 likes | 1.3k Views
Chapter 6: Physical Transformations of Pure Substances. Homework: Exercises(a only):4, 5, 8, 12, 15 Problems:4, 6,10, 15, 21. Phase Diagrams. Phase - a form of matter that is uniform throughout in chemical composition and physical state (J. Willard Gibbs)

E N D
Chapter 6: Physical Transformations of Pure Substances Homework: Exercises(a only):4, 5, 8, 12, 15 Problems:4, 6,10, 15, 21
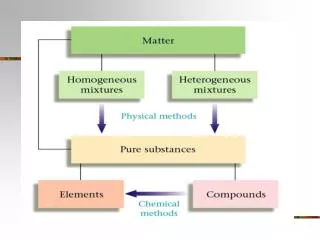
Phase Diagrams • Phase- a form of matter that is uniform throughout in chemical composition and physical state (J. Willard Gibbs) • Homogeneous - one phase present, e.g., glass of cracked ice (not including the glass) • Heterogeneous - more than one phase, e.g., glass of cracked ice with water • Phase transition - spontaneous conversion of one phase to a another • Occurs at characteristic temperature for a given pressure, transition temperature, Ttrs • At Ttrs, phases are in equilibrium and Gibbs energy minimized • Example ice and water at 0°C • This says nothing about the rate the transition occurs • Graphite is the stable phase of carbon at R.T., but diamonds exist because rate of thermodynamically “spontaneous” to low • Such kinetically persistent unstable phases are called metastable phases • Phase Diagram is a P,T plot showing regions of thermodynamically stable phases • Lines separating phases are called phase boundaries • Vapor-liquid boundary shows variation of vapor pressure with temperature • Solid-liquid boundary shows variation of sublimation pressure with temperature
pc 1 atm = pex Tb Phase Boundaries (cont.) • Boiling Points • Temperature at which vapor pressure equals external pressure • Normal boiling point (Tb) external pressure = 1 atm (H2O: 100.0°C) • Standard boiling point external pressure = 1 bar (0.987 atm) (H2O: 99.6°C) • Critical Point • In closed vessel boiling does not occur. Pressure increases and fluid level drops. rliquid decreases and rvapor increase as T increases • At some point rliquid = rvapor and boundary disappears: critical temperature (Tc),vapor pressure is critical pressure, pc • Above a single uniform phase exists, supercritical fluid • Highest temperature liquid can exist • Melting Points • Melting temperature both solid and liquid phases exist. • Equivalent to freezing temperature • Normal freezing(melting) point (Tf) external pressure = 1 atm (H2O: 0°C) • Standard freezing point external pressure = 1 bar (0.987 atm) • Triple Point (T3) - place at which 3 phase boundaries meet • All 3 phases exist simultaneously • Typically solid, liquid and gas • Lowest pressure and temperature liquid can exist • Invariant, property of substance (H2O: 273.15K, 6.11 mbar) supercritical fluid
Ice VI,VII, liquid 22 kbar, 81.6 °C Phase Diagrams - Water Ice VI,VII, VIII 21 kbar, ~5 °C • Slope of solid-liquid boundary means large Dp necessary to significantly change melting temp. • Negative slope means Tmelt decreases as p increase • Due to structure of water • Liquid has lower volume than solid (rliquid>rsolid) • High pressure phases • Different crystal structure and density • Ice I (hexagonal); Ice III (Tetragonal) • At -175°C and 1 atm: Ice I (r = 0.94 g/cc); Ice VI (r = 1.31 g/cc); • Can melt at higher temperatures than Ice I • Ice VII melts at 100°C but only exists at p>25 kbar • 8 triple points (6 plotted) • Only one between solid (Ice I), liquid and gas
Phase Diagrams - Carbon Dioxide • Melting temperature increases a p increases • Unlike water& more typical • T3 > 1 atm • Liquid CO2 doesn’t exist at 1 atm • High pressure CO2 tanks contain liquid • At 25°C (298.15 K) and 67 atm, gas and liquid co-exist
3He 4He Phase Diagrams - Helium • Note temperature scale (< 6K) • Solid and gas never in equilibrium • Two liquid phases • Phase boundary l-line (type of phase transition) • Higher temperature liquid (He-I) is regular liquid • Low temperature liquid (He-II) superfluid (zero viscosity) • It rather than solid exists close to 0K • Phase diagram depends on nuclear spin • 3H - non-zero spin, 4H -zero spin • 3H diagram different than 43H, esp. low temperature • 3H Sliquid < Ssolid, melting exothermic
Gibbs Energies and Phase Diagrams • Chemical potential (µ) - for one component system µ =Gm • Measure of the potential of a substance to bring about change • More detail in Chapters 7 & 9 • At equilibrium, µ is the same throughout the system • Regardless of number of phases • If µ1 is chem. potential of phase 1 and µ2 is chem. potential of phase 2, at equilibrium µ1 = µ2 • Consequence of 2nd Law of Thermodynamics • If dn is transferred from one location (phase) to another, -µ1dn, is the change in Gibbs energy in that phase and µ2dn is change in free energy in the second phase. • dG = -µ1dn + µ2dn = (µ2 - µ1)dn • If µ1 > µ2 dG < 0 and change spontaneous • If µ1 = µ2 dG = 0 and system at equilibrium • Transition temperature is that temperature where µ1 = µ2 • Chemical potentials of phases change with temperature • At low T and reasonable p, solid has lowest µ and, hence, most stable • As T raised, µ of other phase may become less than solid(at that temp.) so it becomes stable phase
Vm(l)> Vm(s) Vm(s)> Vm(l) T and p Dependence on Melting • Recall, (∂G/∂T)p = -S so (∂µ/∂T)p = -Sm • Since Sm> 0 for all pure substances, (∂µ/∂T)p < 0 or a plot of µ vs. T will have a negative slope • Because Sm(gas)> Sm(liquid)> Sm(solid)> slopes going from gas ® solid increasingly negative • Transitions (melting, vaporization) occur when µ of one phase becomes greater than another so substances melt when µ(liquid)>µ(solid) • Phase change means modifying relative values of µ for each phase • Given differences in slopes, change in T easiest way to do it • Similarly, (∂G/∂p)T = V so (∂µ/∂T)p = Vm • Because Vm increases with p, graph of µ vs. T translates upward as p increases • For most substances Vm(l)> Vm(s), µ(l) increases more than µ(s), Tfincreases as p increases (a) • Consistent with observations and physical sense higher p retards movement to lower density • Water exception since Vm(s)> Vm(l), as p increases µ(s) increases more than µ(l), so Tfdecreases as p increases (b)
Assessing Effect of Pressure on Melting Example 6.1 Calculate Dµ for each state over pressure range, Dµ (water) D p = 1 bar; Dµ (ice) D p = 1 bar • Dµ (water) = 1.80 J mol-1 and Dµ (ice) = 1.97 J mol-1 • J mol-1 are units of µ just like G • Dµ (water) < Dµ (ice), so tendency for ice to melt • Look at Self Test 6.2(opposite of water)
Effect of Pressure on Vapor Pressure • When pressure applied to a condensed phase (solid or liquid), vapor pressure increases, i.e., molecules move to gas phase • Increase in p can be mechanical or with inert gas • Ignore dissolution of pressurizing gas in liquid • Ignore gas solvation, attachment of liquid molecules to gas-phase species • Vapor pressure in equilibrium with condensed phase is the partial vapor pressure of the substance, p* p = p*eVmDP/RT [1] Proof ® Math Moment: ex = 1+ x + 1/2x2 +…. If x<<1, .e ≈ 1 + x • [1] becomes p = p*(1 + VmDP/RT) If VmDP/RT<<1 or
µa = µb Location of Phase Boundaries • Phase boundaries occur when chemical potentials are equal and phases are in equilibrium, or for phases a and b: µa(p,T) = µb(p,T) • Need to solve this equation for p, p= f(T) • On plot of p vs. T, f(T) is a gives the phase boundary • Slopes of phase boundaries • Slope is dp/dT • If p and T are changed such that two phases, a and b , are in equilibrium, dµa = dµb But, dµ = -SmdT + Vdp So, -Sa,m,dT + Va,mdp = -Sb,m,dT + Vb,mdp Or(Sb,m,-Sa,m,)dT + = (Vb,m- Va,m )dp But (Sb,m,- Sa,m,) = DtrsS and (Va,m - Vb,m) = DtrsV • This rearranges to: dp/dT = DtrsS / DtrsV where and are the entropy and volume of transition • This is called the Clapeyron Equation • Exact expression for the phase boundary at equilibrium • Can be used to predict appearance of phase diagrams and form of boundaries
This is straight line of slope [DfusH / (T*DfusV)] Solid-Liquid Boundary • For solid-liquid boundary, Clapeyron Equation becomes dp/dT = DfusS / DfusV where DfusV is the change in molar volume on melting • DfusS is always positive (except for 3He) and DfusV is usually smallso dp/dT is large (steep slope) and positive • Formula for phase boundary comes from integrating Clapeyron equation Math Moment: ln(1+x) = x - 1/2x2 +…. If x<<1, ln(1 + x) = x
Integrating Clausius-Clapeyron equation gives variation of vapor pressure with temperature Assumes DvapH is independent of T and p* is vapor pressure at T* and p the vapor pressure at T • This is a curve, not a line • Does not extend beyond Tc Liquid Vapor Boundary • Again, Clapeyron equation can be used • DvapV is large and positive so dp/dT is positive, but smaller than for solid-liquid transition • DvapH/T is Trouton’s constant • Because Vm(gas) >> Vm(liquid), DvapV ≈ Vm(gas) • For ideal gas, Vm(gas) = RT/p so DvapV ≈ RT/p • Clapeyron equation becomes
Solid-Vapor Boundary • Solid-vapor boundary same as liquid vapor boundary except use DsubH instead of DvapH • Since DsubH > DvapH, slope of curve is steeper • Curves coincide at triple point along with solid-liquid boundary
V, H. S Cp µ Ttrs Ttrs Ttrs Classification of Phase TransitionsEhrenfest Clasification • We’ve been talking a lot about the slopes of phase transitions, (∂µ/∂T)p or (∂µ/∂V)T • Transitions are accompanied by changes in entropy and volume • At transition from a phase, a, to another phase, b (∂µb /∂T)p - (∂µa /∂T)p = -Sb,m + Sa,m = - Strs = -DtrsH/T (∂µb /∂p)T - (∂µa /∂p)T = Vb,m - Va,m = -DtrsV • 1st Order Transitions (e.g., melting, vaporization) • Since DfusH, DvapH and DfusV, DvapV are non-zero, the changes in µ {(∂µ/∂T)p or (∂µ/∂p)T} as you approach the transition are different. • There is a discontinuity at the transition • A transition in which the slope of µ, (∂µ/∂T)p , is discontinuous is called a 1st order transition • Cp is slope of plot of H vs. T (∂H/∂T)p at 1st order transition is infinite • Infinitesimal change in T produces finite change in H
Cp V, S, H µ Ttrs Ttrs Ttrs Classification of Phase TransitionsEhrenfest Classification (continued) • 2nd Order Transition (glass transition, superconducting to conducting transition) • (∂µ/∂T)p , is continuous • Volume and entropy don’t change at transition • (∂2µ/∂T2)p is discontinuous • Heat capacity is discontinuous, but not infinite • l -Transition (4He super-fluid to liquid transition, order-disorder transition in b-brass) • Not 1st order, (∂µ/∂T)p , is continuous • Heat capacity is discontinuous, and infinite at transition temperature
Liquid Surfaces • Surface effects can be expressed in terms of thermodynamic functions since work is required to change the surface area of a liquid • If s is the surface area of a liquid, ds is its infinitesimal change when an amount of work, dw is done • dw is proportional to the surface area of the liquid, i.e., dw = gds • g the proportionality constant is defined as the surface tension • Dimensions of g : energy/area (J/m2 or N/m) • To calculate the work needed to create or change a surface by a particular area increment you only need to calculate the area since is a constant • Look at Self Test 6.4 • At constant volume and temperature the work is the Helmholtz energy (A) dA = gds • As ds decreases the Helmholtz energy minimizes • This is the direction of spontaneous change so surfaces of liquids tend to contract • Often minimizing of dA results in curved surfaces
Curved Liquid Surfaces • Bubble - a region in which vapor (+ air) is trapped by thin film • Bubbles have 2 surfaces one on each side of the film • Cavityis a vapor-filled hole in liquid (commonly called bubbles) but 1/2 the surface area • Droplet - small volume of liquid surrounded by vapor (+air) • Pressure inside a concave surface (pin) is always greater than pressure outside (pout) • Difference depends on surface area and surface tension pin = pout + 2g/r Laplace eqn • As r ® ∞ (flat surface), pin = pout • As r ® small(small bubbles), 2g/rimportant • Earlier we saw, the vapor pressure in the presence of external pressure Dp is p = p*eVmDP/RT • So, for bubble since Dp = 2g/r p = p*e2gVm/rRTKelvin Equation (bubble) • In a cavity, pout < pin, so sign of exponential term is reversed p = p*e-2gVm/rRTKelvin Equation (cavity)
Nucleation, Superheating &Supercooling • Nucleation • For water droplets • r =1µm; @25°C, p/p* = 1.001 • Small effect but mat have important consequences • r =1nm; @25°C, p/p* = 3 • Clouds form when water droplets condense. Warm moist air rises, condenses at colder altitude • Initial droplets small so Kelvin equation tells us vapor pressure of droplet increases • Small droplets tend to evaporate • Unless large numbers of molecules congregate (spontaneous nucleation) • Air becomes supersaturated and thermodynamically unstable • Nucleation centers (dust particles, sea salt) allow clouds to form by allowing condensation to occur on larger surfaces • Superheating - liquids persist above boiling point • Vapor pressure inside a small cavity in liquid is low so cavities tend to collapse • Spontaneous nucleation causes larger more stable cavities (and bumping!) • Nucleation centers allow for stabilization of cavity • Basis of bubble chamber • Supercooling, persistence of liquids past freezing point, is analogous
Capillaries • Capillary action - tendency of liquids to rise up/fall in narrow bore (capillary) tubes • Capillary rise/fall • If liquid has tendency to adhere to the tube walls (e.g. water), energy lowest when most surface is covered • Liquid creeps up wall (concave meniscus) • Pressure beneath curve of meniscus is lower than atmosphere by 2g/r, where r is radius (Kelvin equation, cylindrical tube) • Pressure at flat surface = atmospheric pressure (r ® ∞) • Liquid rises in capillary until hydrostatic equilibrium is reached • As liquid rises p increases by rgh (r = density; h= height) • At equilibrium, pcapillary = pexternal or2g/r = rgh Height of capillary rise h = 2g/rgr • As tube gets smaller, h gets higher • Can be used to measure surface tension of liquids • gis temperature dependent • If liquid has a tendency not to adhere (e.g. Hg) liquid will fall in capillary because pressure less under meniscus • Treatment the same, except sign reversed
Contact Angle • Contact angle is the angle between edge of meniscus and wall • If qc ≠ 0, then the equation for capillary rise becomes h = 2g(Cosqc)/rgr • Arises from balance of forces at the point of contact between liquid and solid • The surface tension is essentially the energy needed to create a unit area of each of the interfaces • gsg = Energy to create unit area at gas-solid interface • glg = Energy to create unit area at gas-liquid interface • gsl = Energy to create unit area at solid-liquid interface • At equilibrium, the vertical forces in capillary are in balance so gsg =gsl + Cos(qc) glg Or Cos(qc) =( gsg -gsl )/ glg See diagram® “wets” • Work of adhesion (wad) of liquid to solid is gsg+ glg - gsl • So Cos(qc) =( gsg -gsl )/ glg =(wad -glg )/ glg=(wad / glg ) - 1 • If liquid wets surface 0° < qc < 90° , 1> Cos(qc) > 0so 1< (wad / glg ) < 2 • If liquid doesn’t wet surface 90° < qc < 180° , 0> Cos(qc) > -1 so 1> (wad / glg ) >0 • Takes more work to overcome cohesive forces in liquid “doesn’t wet”