Download
1 / 27
280 likes | 782 Views
Technology, Production, and Costs. Sony Uses a Cost Curve to Determine the Price of Radios. 1. 2. 3. 4. 5. 6. After studying this chapter, you should be able to: Define technology and give examples of positive and negative technological change.

E N D
Sony Uses a Cost Curve to Determine the Price of Radios 1 2 3 4 5 6 • After studying this chapter, you should be able to: Define technology and give examples of positive and negative technological change. Distinguish between the economic short run and the economic long run. Understand the relationship between the marginal product of labor and the average product of labor. Explain and illustrate the relationship between marginal cost and average total cost. Graph average total cost, average variable cost, average fixed cost, and marginal cost. Understand how firms use the long-run average cost curve to plan. LEARNING OBJECTIVES In this chapter, we will focus on the relationship between a firm’s technology and its production costs.
Technology: An Economic Definition 1 LEARNING OBJECTIVE Technology The processes a firm uses to turn inputs into outputs of goods and services. Technological change A change in the ability of a firm to produce a given level of output with a given quantity of inputs.
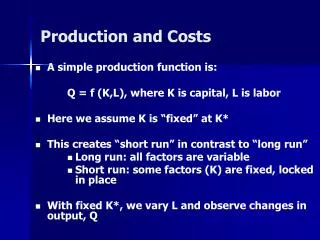
The Short Run and the Long Run 2 LEARNING OBJECTIVE Short run The period of time during which at least one of the firm’s inputs is fixed. Long run A period of time long enough to allow a firm to vary all of its inputs, to adopt new technology, and to increase or decrease the size of its physical plant.
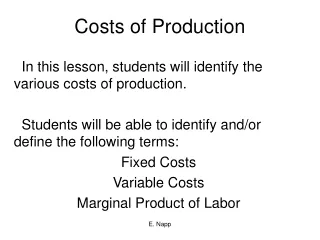
The Short Run and the Long Run The Difference between Fixed Costs and Variable Costs Total cost The cost of all the inputs a firm uses in production. Variable costs Costs that change as output changes. Fixed costs Costs that remain constant as output changes. Total Cost = Fixed Cost + Variable Cost TC = FC + VC
The Short Run and the Long Run Implicit Costs versus Explicit Costs Opportunity cost The highest-valued alternative that must be given up to engage in an activity. Explicit cost A cost that involves spending money. Implicit cost A nonmonetary opportunity cost.
The Short Run and the Long Run Jill Johnson’s Costs per Year 7 – 1 The Production Function Production Function The relationship between the inputs employed by the firm and the maximum output it can produce with those inputs.
The Short Run and the Long Run Short-Run Production and Cost at Jill Johnson’s Copy Store 7 – 2 A First Look at the Relationship Between Production and Cost Average total cost Total cost divided by the quantity of output produced.
The Short Run and the Long Run 7 - 1 Graphing Total cost and Average Total Cost at Jill Johnson’s Photocopy Store A First Look at the Relationship Between Production and Cost
The Marginal Product of Labor and the Average Product of Labor 3 LEARNING OBJECTIVE Marginal product of labor The additional output a firm produces as a result of hiring one more worker. The Law of Diminishing Returns Law of diminishing returns The principle that, at some point, adding more of a variable input, such as labor, to the same amount of a fixed input, such as capital, will cause the marginal product of the variable to decline.
The Marginal Product of Labor and the Average Product of Labor Marginal and Average Product of Labor at Jill Johnson’s Copy Store 7 – 3 The Law of Diminishing Returns
The Marginal Product of Labor and the Average Product of Labor 7 - 2 Total Output and the Marginal Product of Labor Graphing Production
The Marginal Product of Labor and the Average Product of Labor The Relationship between Marginal and Average Product Average product of labor The total output produced by a firm divided by the quantity of workers.
The Marginal Product of Labor and the Average Product of Labor 7 - 3 Marginal and Average GPAs An Example of Marginal and Average Values: College Grades
The Relationship Between Short-Run Production and Short-Run Cost 4 LEARNING OBJECTIVE Marginal Cost Marginal Cost The change in a firm’s total cost from producing one more unit of a good or service.
The Relationship Between Short-Run Production and Short-Run Cost 7 - 4 Jill Johnson’s Marginal Cost and Average Cost of Producing Copies Why Are the Marginal and Average Cost Curves U-Shaped?
7 - 1 4 LEARNING OBJECTIVE • The Relationship Between Marginal Cost and Average Cost
Graphing Cost Curves 5 LEARNING OBJECTIVE Average fixed cost Fixed cost divided by the quantity of output produced. Average variable cost Variable cost divided by the quantity of units produced. Average total cost = ATC = TC/Q Average fixed cost = AFC = FC/Q Average variable cost = AVC = VC/Q ATC = AFC + AVC
Graphing Cost Curves Costs at Jill Johnson’s Copy Store 7 - 5
Costs in the Long Run 6 LEARNING OBJECTIVE Economies of Scale Long-run average cost curve A curve showing the lowest cost at which the firm is able to produce a given quantity of output in the long run, when no inputs are fixed. Economies of scale Economies of scale exist when a firm’s long-run average costs fall as it increases output.
Costs in the Long Run Economies of Scale Constant returns to scale Constant returns to scale exist when a firm’s long-run average costs remain unchanged as it increases output. Minimum efficient scale The level of output at which all economies of scale have been exhausted. Diseconomies of scale Exist when a firm’s long-run average costs rise as it increases output.
Costs in the Long Run 7 - 6 The Relationship between Short-Run Average Cost and Long-Run Average Cost Long-Run Average Total Cost Curves for Bookstores
7 - 2 6 LEARNING OBJECTIVE • Using Long-Run Average Cost Curves to Understand Business Strategy
7 - 4 • The Colossal River Rouge: Diseconomies of Scale at the Ford Motor Company Is it possible for a factory to be too big?
Don’t Confuse Diminishing Returns with Diseconomies of Scale
Conclusion A Summary of Definitions of Cost 7 – 4
Long-run average cost curve Marginal cost Marginal product of labor Minimum efficient scale Opportunity cost Production function Short run Technological change Technology Total cost Variable costs • Average fixed cost • Average variable cost • Average product of labor • Average total cost • Constant returns to scale • Diseconomies of scale • Economies of scale • Explicit cost • Fixed costs • Implicit cost • Law of diminishing returns • Long run