Download
1 / 9
90 likes | 276 Views
EST 612. Environmental Policy and Governance The United States and China: A Brief Comparison. David A. Sonnenfeld Dept. of Environmental Studies College of Environmental Science and Forestry State University of New York Syracuse, NY, 13210 USA . February 2011.

E N D
EST 612. Environmental Policy and GovernanceThe United States and China: A Brief Comparison David A. Sonnenfeld Dept. of Environmental Studies College of Environmental Science and Forestry State University of New York Syracuse, NY, 13210 USA February 2011
United States of America (USA) • World's largest economy • $12.15 trillion GNI per year, 3.4% growth rate(2004 est.) • $40 billion FDI(2002 est.) • $37,388 GDP per capita(2003 est.) • Population: 298.4 million, 1.0% growth rate(2006 est.) • Ecological footprint(2003 est.) • United States: 9.6 ha per capita • Finland: 7.6 ha per capita • Canada: 7.6 ha per capita • CO2 emissions • 22.5 % of total CO2 emissions(1998 est.) • CO2 emissions: 19.8 metric tons/ per capita(2000 est.) • CO2 emissions: 5,590 mmt total(2000 est.)
Environmental Quality in the USA Per Cent Source: US EPA (2004)
Environmental Quality in the USA Source: US EPA (2003)
People’s Republic of China • World's fastest growing economy • $1.68 trillion GNI per year, 8.8% growth rate (2004 est.) • $49 billion FDI (2002 est.) • $1,094 GDP per capita (2003 est.) • Population • 1/5 of world’s total • 1.3 billion, 0.7% growth rate(2006 est.) • Ecological footprint(2003 est.) • China: 1.6 ha per capita • Albania: 1.4 ha per capita • Dominican Rep.: 1.6 ha per capita • CO2 emissions • CO2 emissions: 2.2 metric tons/ per capita (2000 est.) • CO2 emissions: 2,780 mmt(2000 est.)
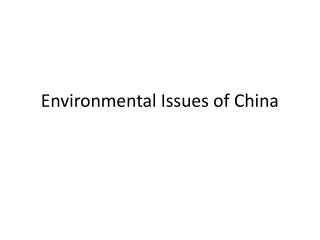
Environmental Quality in China Source: Liu and Diamond (2005)
Environmental Quality in China Source: Liu and Diamond (2005)
Environmental Quality in China Source: Liu and Diamond (2005)